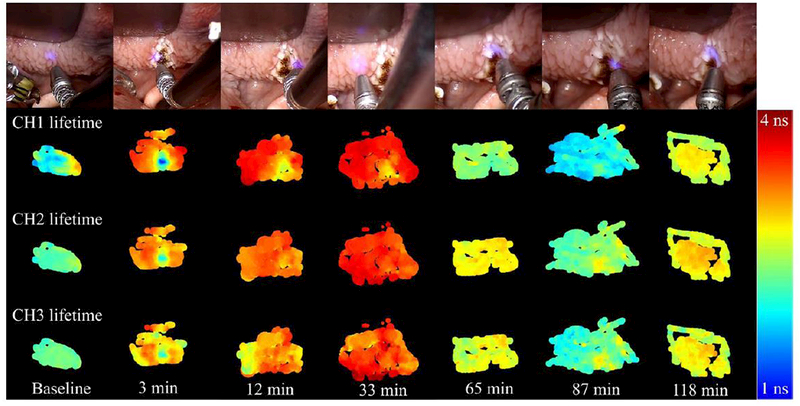
Figure 4.

Base of tongue autofluorescence lifetime maps (channels 1, 2 and 3) for baseline and all time points following cauterization of the tissue. Top row shows white light images captured with the da Vinci Surgical System at the time of measurement.
