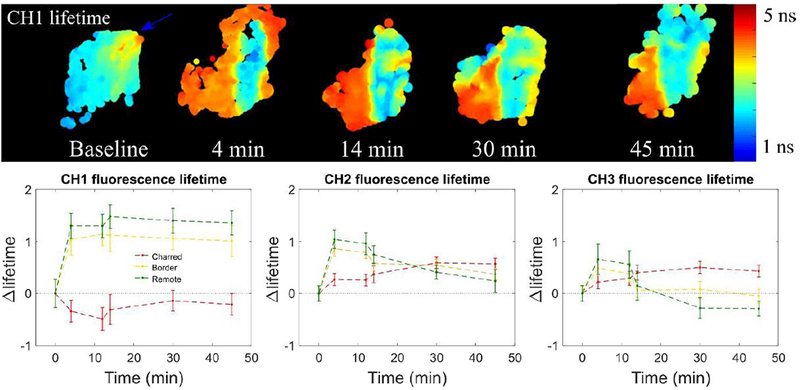
Figure 8.

Summary of muscle measurements for baseline and different time points following cauterization of the tissue depicted through channel 1 autofluorescence lifetime. Maps of all autofluorescence lifetime and intensity parameters are provided in the supplement for all time points studied.
