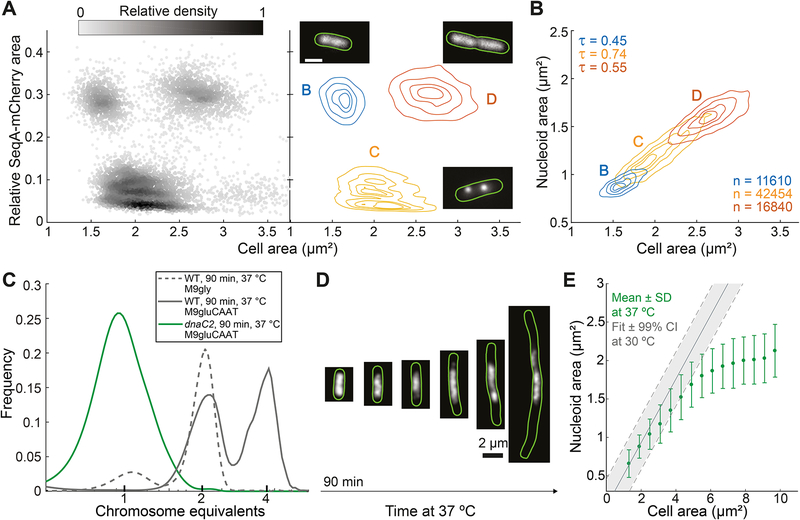
Figure 2. Nucleoid size scaling with cell size does not depend on DNA replication.
A. Density scatter plot (left) and density contour plot (right) of cell area versus the relative SeqA-mCherry signal area of E. coli cells (CJW6324) grown in M9gly medium. The gray scale in the density scatter plot indicates the relative density of dots (cells) in a given area of the chart. This plot was used to identify cells in the B, C and D cell cycle periods found under these growth conditions. The contour lines represent the 0.10, 0.25, 0.50 and 0.75 probability envelopes of the data. Insets: representative images of the subcellular SeqA-mCherry signal in a specific cell cycle period.
B. Density contour plots of cell area versus nucleoid area for cells in B, C and D periods based on the analysis shown in panel A. The contour lines represent the 0.10, 0.25, 0.50 and 0.75 probability envelopes of the data. The nucleoid was detected by DAPI staining. See also Figure S3.
C. Frequency distributions of genome equivalents per cell for the indicated strains after a replication run-out experiment, performed 90 min after temperature shift from 30 to 37 °C. Wild-type cells grown in M9gly undergo a single cycle of DNA replication per division cycle and were included as a control to estimate the DAPI intensities corresponding to 1 and 2 genome equivalents.
D. Representative fluorescence images of dnaC2 cells (strain CJW6370, growing in M9gluCAAT) producing HU-mCherry after a shift to a restrictive temperature (37 °C).
E. Plot showing the average nucleoid area per cell area bin for HU-mCherry-labeled dnaC2 cells at 37 °C. Cells (n = 12268) from different time points (90–300 min) following temperature shift were combined into one dataset and grouped into bins based on their cell areas. Shown are the average nucleoid area and standard deviation (SD) of each cell area bin. The solid grey line indicates the expected relationship between nucleoid and cell area based on the scaling observed under permissive conditions (30 °C). The dotted lines indicate the 99% confidence interval (CI) of the fit.

