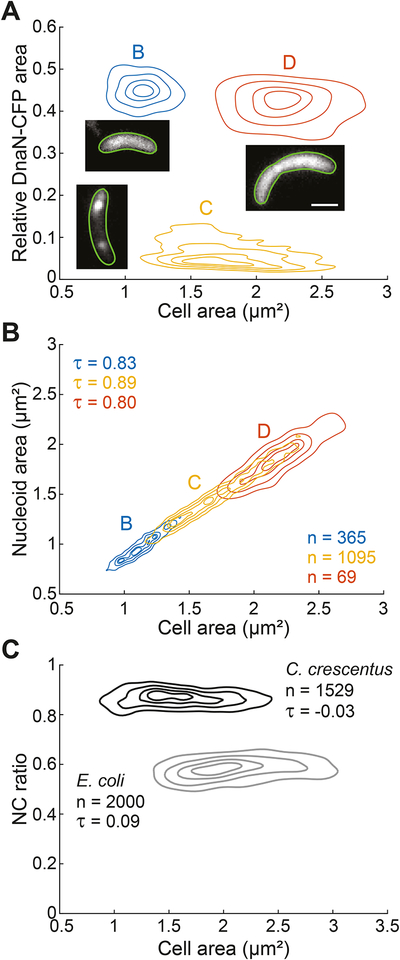
Figure 3. Nucleoid size scaling is also observed in C. crescentus, a bacterium with a different NC ratio.
All contour lines represent the 0.10, 0.25, 0.50 and 0.75 probability envelopes of the data.
A. Density contour plot of cell area versus the relative DnaN-CFP signal area of C. crescentus cells (CJW5969) grown in M2G. This plot was used to identify cells in the B, C and D cell cycle periods. Insets: representative images of the subcellular DnaN-CFP signal in a specific cell cycle period.
B. Density contour plots of cell area versus nucleoid area for cells in panel A. The nucleoid was detected by HU-mCherry labeling.
C. Density contour plots of cell area versus NC ratio for E. coli (CJW6324) and C. crescentus (CJW5969) cells grown in M9gly and M2G, respectively. The nucleoid was detected by DAPI staining for E. coli and by HU-mCherry labeling for C. crescentus.
See also Figure S4.

