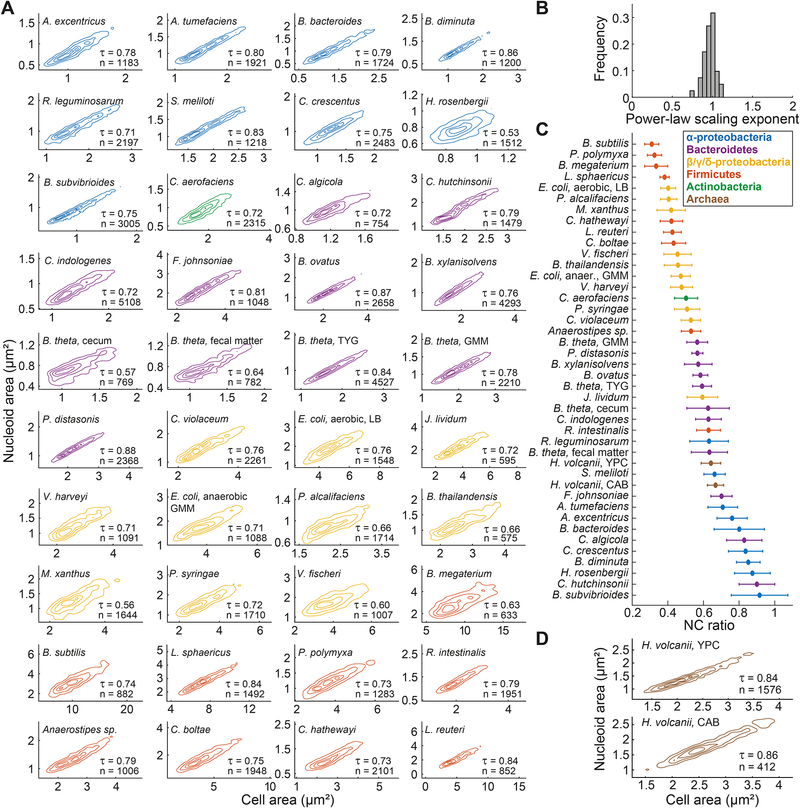
Figure 4. Nucleoid size scaling across bacterial species from different phyla reveals a continuum of NC ratios.
A. Density contour plots of cell area versus nucleoid area for fixed cell populations from different bacterial species. The contour lines represent the 0.10, 0.25, 0.50 and 0.75 probability envelopes of the data. When different growth conditions were examined for the same species, the growth medium is indicated next to the species name. Contours of the same color indicate affiliation to the same phylum or class. The DNA dye used for nucleoid labeling for each species is detailed in the STAR Methods.
B. Frequency distribution of power-law scaling exponents between cell area and nucleoid area for all the included species.
C. Average NC ratio (with error bars representing the standard deviation) for all the included species.
D. Density contour plots of cell area versus nucleoid area for live H. volcanii cells grown in YPC and CAB medium. The contour lines represent the 0.10, 0.25, 0.50 and 0.75 probability envelopes of the data. The nucleoid was detected by SYBR green staining.
See also Figures S5 and S6.

