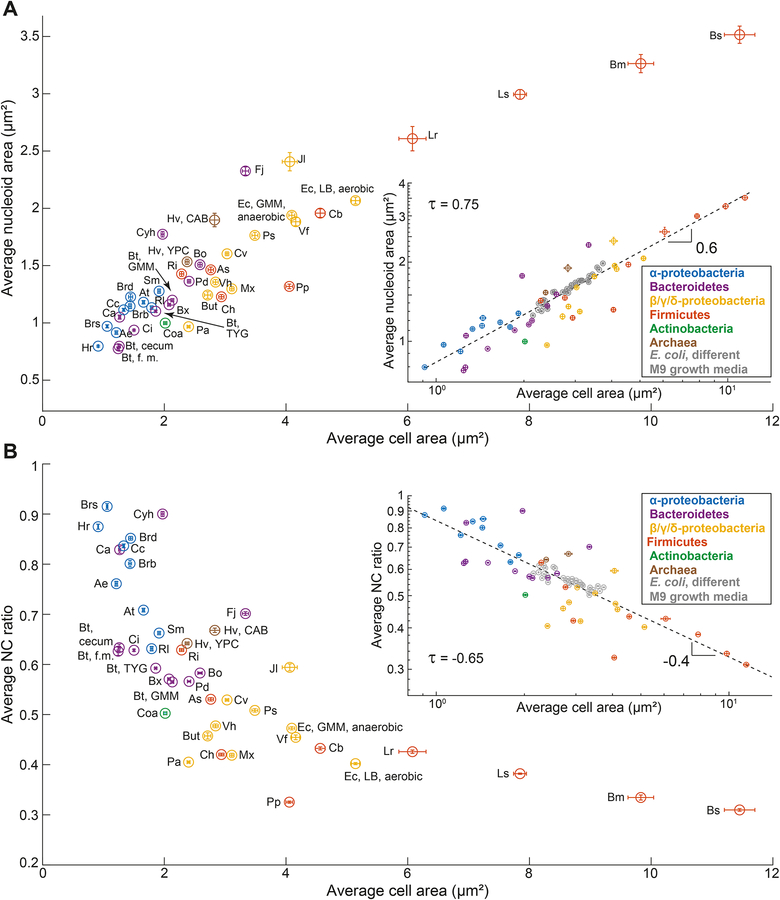
Figure 5. The average NC ratio is linked to the average cell size.
For all plots, error bars indicate 95% confidence intervals. Linear fits on the log-log plots are indicated as dotted lines together with the obtained slope (i.e., the power-law scaling exponent).
A. Scatter plot of average cell area versus average nucleoid area for all the included species. Abbreviated species names are indicated next to the corresponding datapoint; see Key Resources Table for a full name description. Inset: same relationship on a log-log scale.
B. Scatter plot of average NC ratio versus average cell area for all the included species. Inset: same relationship on a log-log scale.

