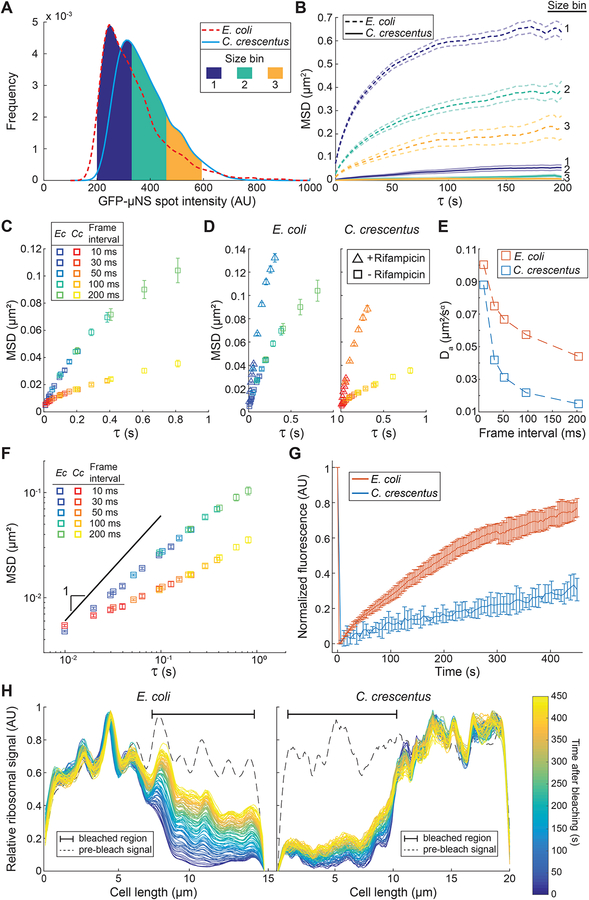
Figure 6. The intracellular mobility of large objects displays non-linear dynamics and is different between E. coli and C. crescentus.
A. Frequency distributions of GFP-μNS spot intensities in E. coli (CJW6723, n = 2142) and C. crescentus (CJW6917, n = 2279) cells. E. coli cells were grown in M9gly and C. crescentus cells in M2G. Three bins of GFP-μNS particles with similar intensities and thus sizes are indicated in color.
B. Ensemble-averaged MSDs of GFP-μNS particles (belonging to the intensity bins highlighted in panel A) in E. coli cells (n = 1208, 600 and 200 for bins 1, 2 and 3, respectively) and C. crescentus cells (n = 837, 984 and 374 for bins 1, 2 and 3, respectively). Lighter-colored lines indicate 95% confidence intervals.
C. Ensemble-averaged MSDs of fluorescently-labeled ribosomes in E. coli (CJW6768, M9glyCAAT) and C. crescentus (CJW5156, M2G) at different acquisition frame intervals. For each frame interval, > 1248 trajectories were collected. Only the first four points of the MSDs are shown for each frame interval. Error bars indicate 95% confidence intervals.
D. Same as in panel C, except that ensemble-averaged MSDs from rifampicin-treated cells (2 h incubation with 50 and 200 μg/ml of rifampicin for C. crescentus and E. coli, respectively) were added for comparison. For each frame interval, > 2535 trajectories were collected in rifampicin-treated cells. For these MSDs, only the first six points are shown for the 10 ms and 50 ms frame intervals. The color scheme for the frame intervals is the same as in panel C. Error bars indicate 95% confidence intervals.
E. Plot showing the apparent diffusion coefficients calculated from the aforementioned MSDs as a function of the frame interval.
F. Same data as in panel C, but on a log-log scale. Line with a slope of 1 was added for comparison.
G. Ensemble analysis showing average ribosomal fluorescence recovery over time (up to 450 s) of cephalexin-treated E. coli cells (CJW4677) and FtsZ-depleted C. crescentus cells (CJW3821) following photobleaching of about half the cell. Errors bars indicate standard deviation. For each species, ribosomal recovery was quantified across a cell segment of 3 μm in 6 cells.
H. Representative plots showing the evolution of the ribosomal fluorescence recovery over time (up to 450 s) along the length of a cephalexin-treated E. coli cell (CJW4677) and an FtsZ-depleted C. crescentus cell (CJW3821) following photobleaching of about half of the cell. The dotted line shows the fluorescence profile prior to bleaching.
See also Figure S7.

