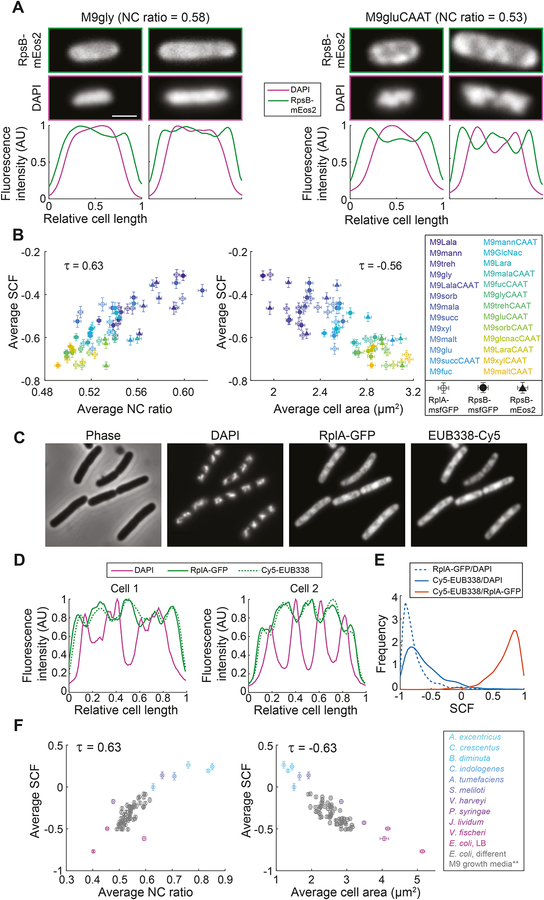
Figure 7. The spatial organization of ribosomes in bacteria is linked to the average NC ratio and the average cell size.
A. Top, representative fluorescence images of E. coli cells (CJW6769) grown in M9gly or M9gluCAAT. Bottom, fluorescence intensity profiles of DAPI and RpsB-mEos2 signals for these cells.
B. Scatter plots of average SCF versus average NC ratio (left) or versus average cell area (right) for E. coli cells producing RpsB-mEos2 (CJW6769), RplA-msfGFP (CJW7020) or RpsB-msfGFP (CJW7021) fusions, grown in the indicated growth media (for a full description of the growth media, see Table S1). The SCF was calculated by comparing the correlation between the DAPI and the ribosomal signals for the indicated strains. Error bars indicate 95% confidence intervals.
C. Representative phase contrast and fluorescence images of E. coli cells (CJW4677) after the FISH procedure, highlighting the correspondence between the use of RplA-GFP and FISH (targeting 16S ribosomal RNA with the Cy5-labeled EUB338 probe) for visualizing ribosome localization. Cells were grown in M9glyCAAT.
D. Fluorescence intensity profiles of DAPI, RplA-GFP, and rRNA FISH (Cy5-EUB338) signals of E. coli cells (CJW4677) indicated in panel C.
E. Frequency distributions of SCF values between the rRNA FISH (Cy5-EUB338), RplA-GFP, and DAPI signals.
F. Scatter plots of average SCF versus average NC ratio (left) or versus average cell area (right). The SCF was calculated by comparing the correlation between the DAPI and the rRNA FISH (Cy5-EUB338) signals for the indicated species. Included are the E. coli data described in panel B, after correction for the fixation effect on the SCF values (see STAR Methods, indicated by ** in the legend). Error bars indicate 95% confidence intervals.
See also Figure S7.

