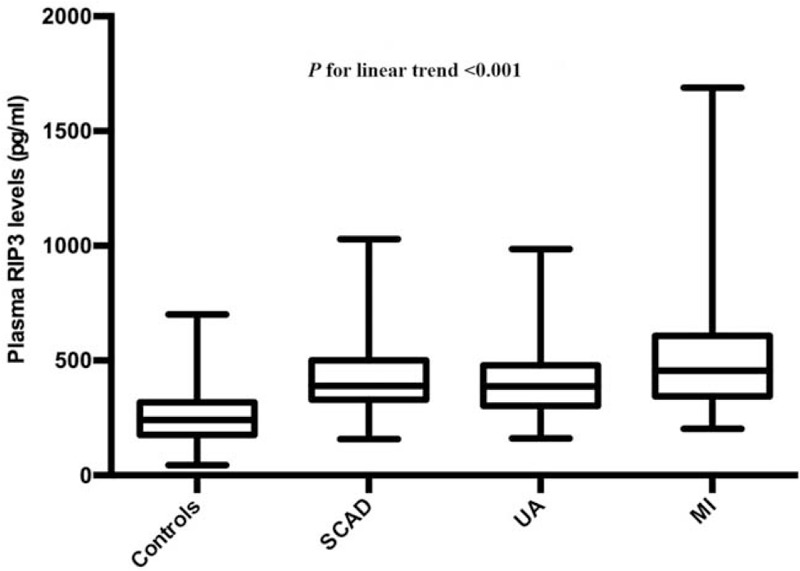
Figure 3.

Plasma RIP3 levels in controls and different subtypes of CAD. Short horizontal lines denote minimum value and maximum value; long horizontal lines denote 25th, 50th, and 75th percentiles. The analysis of variance type of trend analysis was used. CAD: Coronary artery disease; MI: Myocardial infarction; RIP3: Receptor interacting protein kinase-3; SCAD: Stable coronary artery disease; UA: Unstable angina.
