
Figure 1.
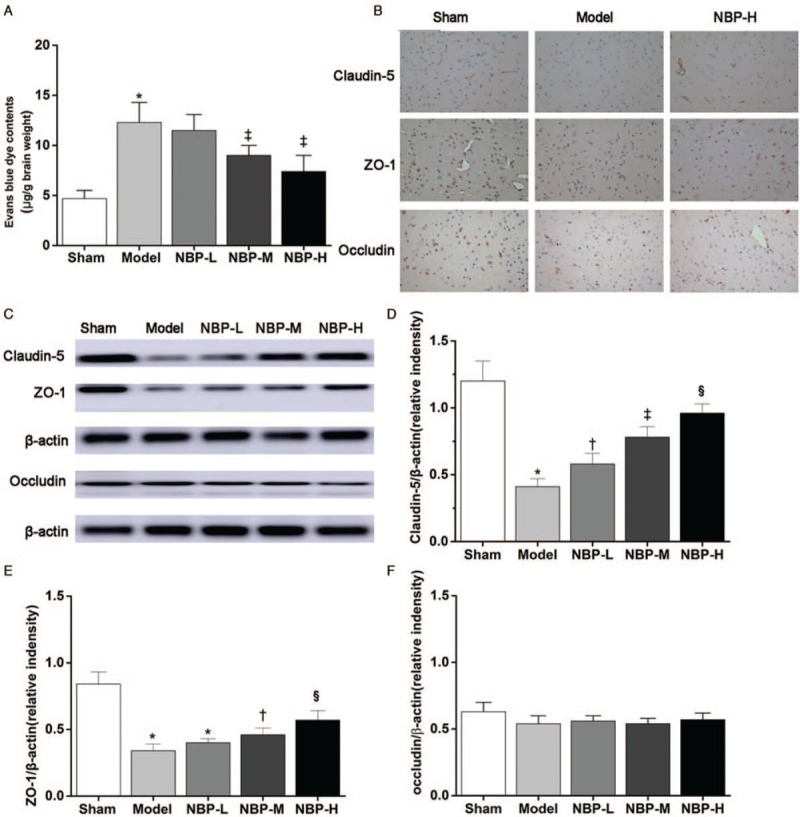
NBP decreased BBB disruption and upregulated the expression of TJ proteins. (A) Evans blue dye leakage (n = 6). (B) Representative immunohistochemistry staining graphs of claudin-5, ZO-1, and occludin (original magnification, ×400). (C) Western blotting images. (D, E, F) Densitometric analysis of protein bands (n = 6). β-actin served as the loading control. ∗P < 0.01 vs. the sham group; †P < 0.05 vs. the model group; ‡P < 0.01 vs. the model group; §P < 0.05 vs. the NBP-M group. BBB: Blood-brain barrier; NBP: DL-3-n-butylphthalide; TJ: Tight junction; ZO-1: Zonula occludens-1.