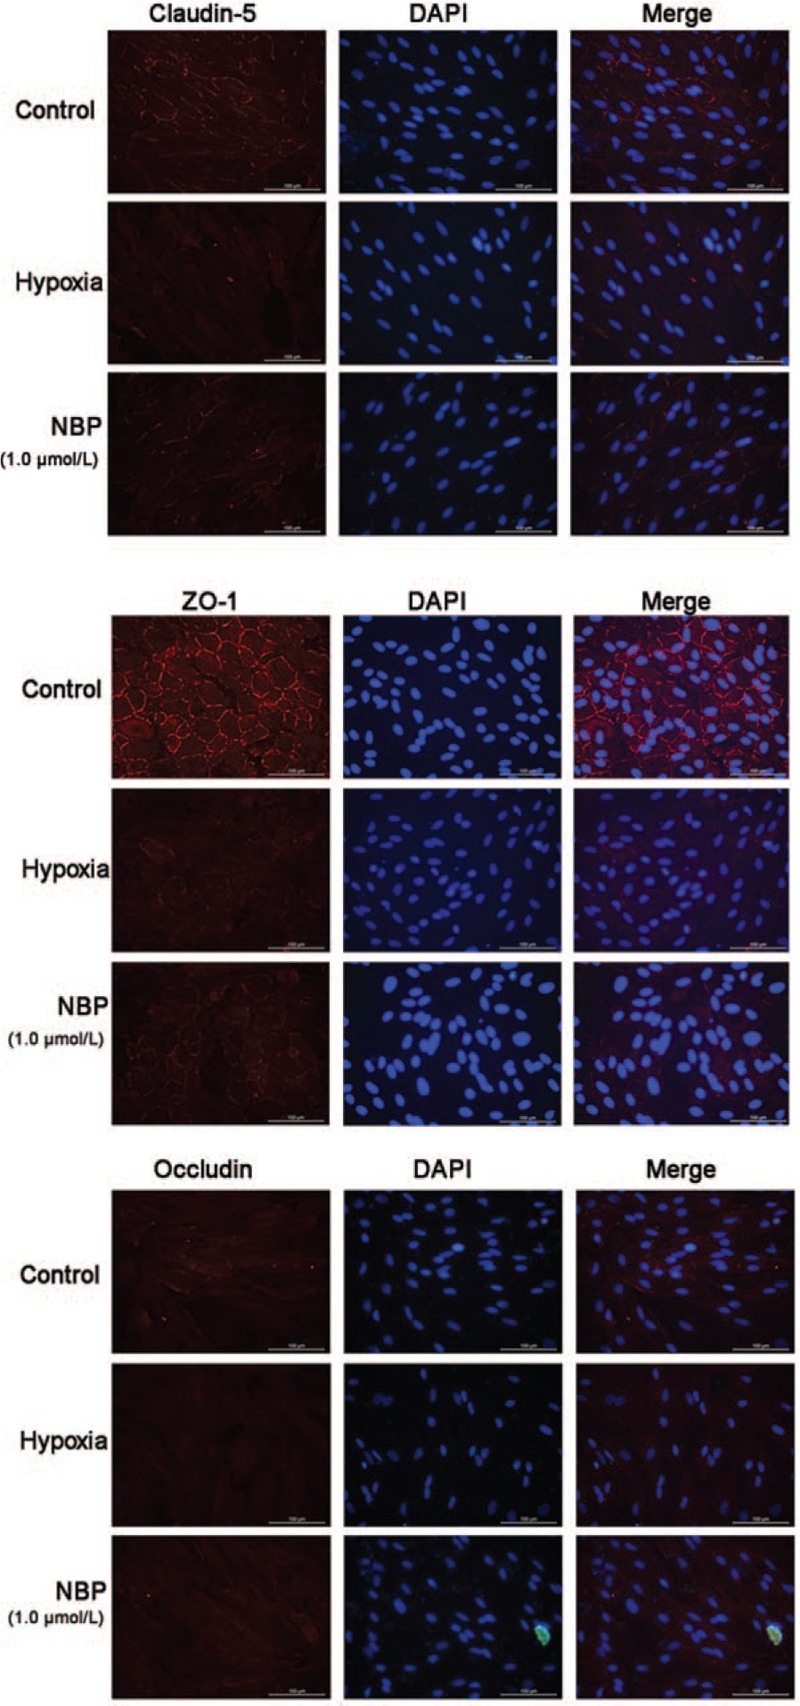
Figure 3.

Expressions of claudin-5, ZO-1, and occludin in rat BMECs analyzed by immunofluorescence. The intensity of the red fluorescence signal represents the expression level of the corresponding protein. The nucleus was counterstained with DAPI (blue fluorescence). Scale bar = 100 μm. BMECs: Brain microvascular endothelial cells; DAPI: 4′,6-Diamidino-2-phenylindole; ZO-1: Zonula occludens-1.
