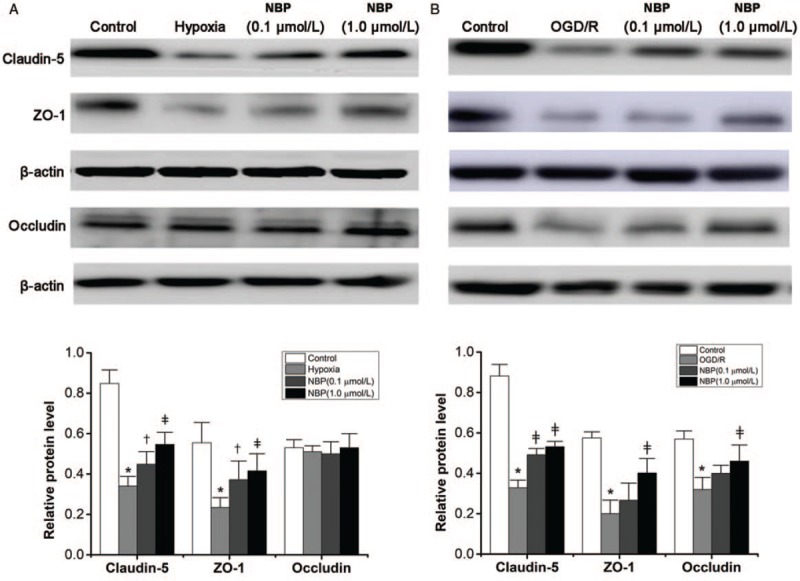
Figure 4.

Expression of tight junction proteins in BMECs analyzed by Western blotting. (A) Protein level of claudin-5, ZO-1, and occludin detected by Western blotting in the hypoxia model and the densitometric analysis of protein expression (n = 6). (B) Protein level of claudin-5, ZO-1, and occludin detected by Western blotting in the OGD/R model and densitometric analysis of protein expression (n = 6). ∗P < 0.01 vs. the control group; †P < 0.05 vs. the hypoxia group or OGD/R group. ‡P < 0.01 vs. the hypoxia group or OGD/R group. BMECs: Brain microvascular endothelial cells; OGD/R: Oxygen-glucose deprivation/reoxygenation; ZO-1: Zonula occludens-1.
