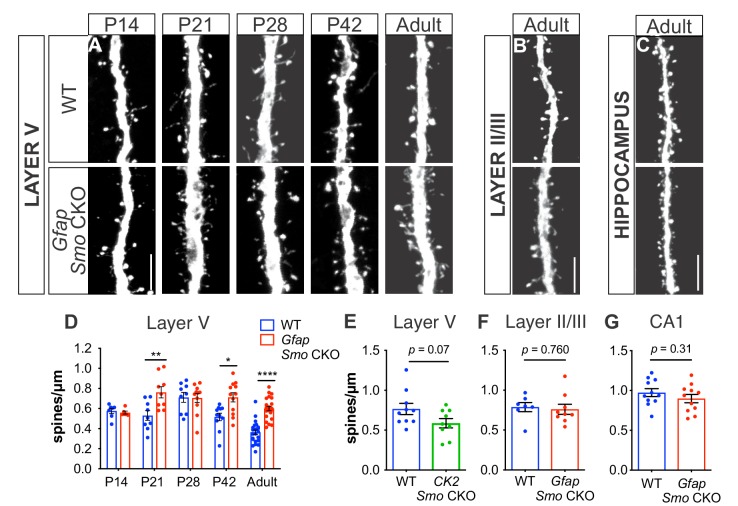
Figure 2. Loss of Shh signaling in astrocytes results in increased spine density on layer V neurons.
(A-C) GFP immunostaining of representative apical dendritic segments from (A) layer V neurons, (B) layer II/III neurons, and (C) CA1 neurons in WT and Gfap Smo CKO mice. Scale bar, 5 μm. (D) Spine density of apical dendrites from layer V neurons across various postnatal ages and in adult mice. Data points represent individual cells, bars represent mean ± SEM. Statistical analysis performed by two-way ANOVA with Tukey’s post-hoc test for multiple comparisons. *, p<0.05; **, p<0.01; ****, p<0.0001. Significance is stated as Gfap Smo CKO compared to WT at a given age. (E) Spine density of apical dendrites from layer V neurons in adult CamKIIa Smo CKO mice. (F–G) Spine density of apical dendrites from layer II/III (F) and CA1 pyramidal neurons (G) in WT and Gfap Smo CKO mice. Data points represent individual cells, bars represent mean ± SEM. Statistical significance assessed by Student’s t-test. n ≥ 3 animals per genotype for all ages except P14, where n = 2 animals per genotype.
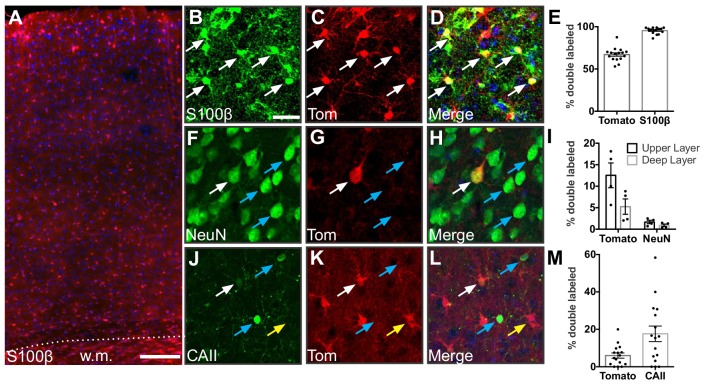
Figure 2—figure supplement 1. Gfap-Cre recombination occurs primarily in astrocytes.
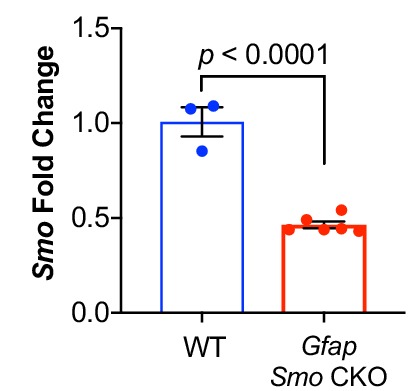
Figure 2—figure supplement 2. Gfap Smo CKO mice have reduced levels of Smo.

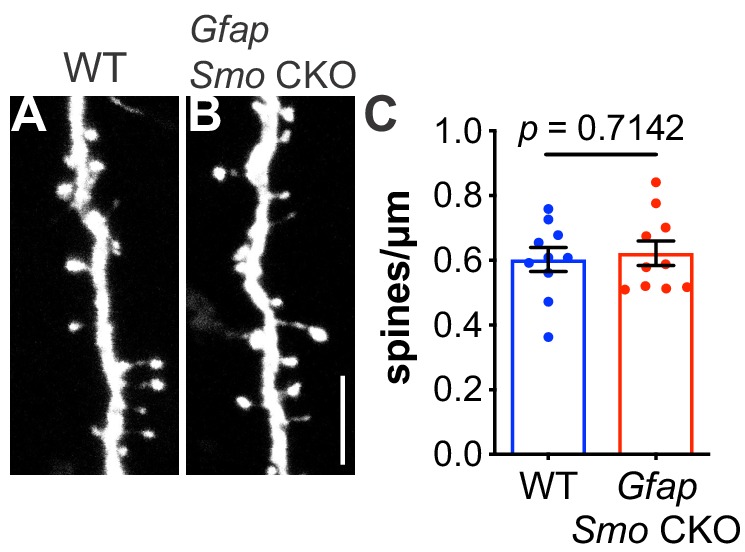
Figure 2—figure supplement 3. Spine density on layer V basal dendrites are not affected in adult Gfap Smo CKO mice.


