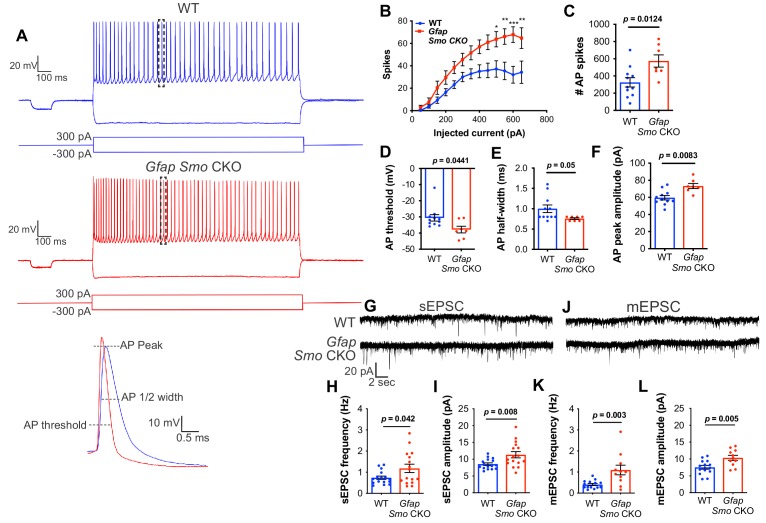
Figure 5. Neurons in Gfap Smo CKO mice exhibit a significant increase in excitability and synaptic transmission.
(A) Example traces of action potentials from layer V pyramidal neurons in WT and Gfap Smo CKO mice at P21. Samples of action potential spikes (dashed lines, lower panel) describe AP threshold, AP peak amplitude, and AP 1⁄2 width of pyramidal neurons. (B) Line graph displays relationship between action potential spike numbers (y-axis) and current injection; Gfap Smo CKO neurons exhibit an increase in AP spikes (>500 pA) compared to WT neurons. Statistical significance was assessed by two-way ANOVA with Sidak’s test for multiple comparisons and stated as Gfap Smo CKO compared to WT at a given current (n = 11 and 7 cells from WT and Gfap Smo CKO, respectively). (C–F) Bar graphs describe an increase in total AP spike numbers (C), reduction in AP threshold (mV) (D), reduction in AP 1/2 width (E), and increase in AP peak amplitude (pA) (F) in Gfap Smo CKO neurons. (G) Example traces of sEPSCs from layer V pyramidal neurons recorded in the presence of picrotoxin from WT and Gfap Smo CKO mice at P21. (H–I) Summary graphs of sEPSC frequency and amplitude (n = 14 and 11 cells from WT and Gfap Smo CKO animals, respectively). (J) Example traces of mEPSCs from layer V pyramidal neurons recorded in the presence of picrotoxin and TTX. (K–L) Summary graphs of mEPSC frequency and amplitude (n = 16 cells per genotype). Gfap Smo CKO neurons exhibit increases in both frequency and amplitude in sEPSCs and mEPSCs recordings. Statistical significance was assessed by unpaired Student’s t-test. For each graph, data points represent individual cells. All data are from at least three animals per genotype.


