. 2019 Jul 2;8:e47145. doi: 10.7554/eLife.47145

Figure 1. Cryo-EM Structure of the cytoplasmic dynein-1 microtubule-binding domain.

(A) Crystal structure of the cytoplasmic dynein-1 MTBD in the low-affinity β +registry (PDB 3ERR) coloured by helix. (B) Schematic of the MTBD constructs used for structure determination. A globular seryl-tRNA synthetase (SRS, grey) has a protruding coiled-coil to which 12-heptads of the dynein stalk is fused (pink). CC1 is three residues longer than CC2 to force the stalk into the high-affinity α registry, allowing the MTBD to bind to the microtubule (α-tubulin in green, β-tubulin in blue) (C) Reconstruction of the cytoplasmic dynein-1 MTBD (pink) bound to microtubule (α-tubulin in green, β-tubulin in blue), lowpass-filtered to 5 Å. (D) New models for the cytoplasmic dynein MTBD (pink) and tubulin (α-tubulin in green, β-tubulin in blue) was refined into the cryo-EM density (lowpass filtered to 5 Å) (E) Representative density of different regions of the map, filtered and sharpened according to local resolution.

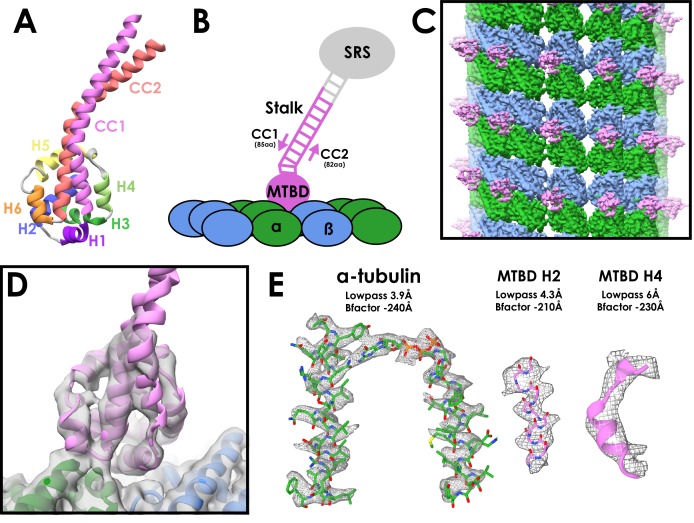
Figure 1.

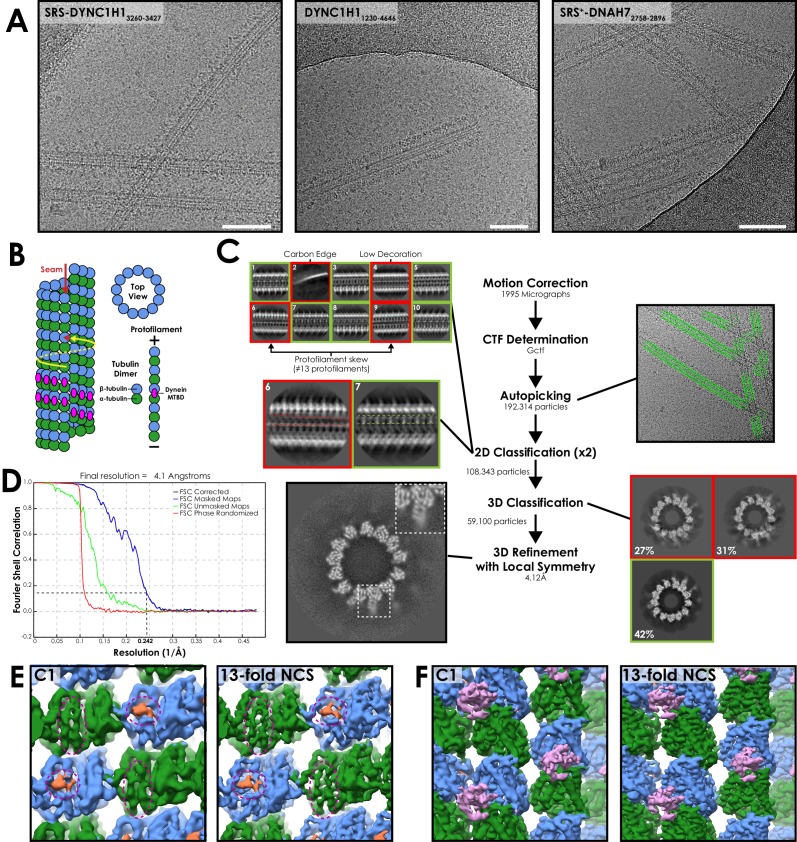
Figure 1—figure supplement 1. Processing workflow of the SRS-DYNC1H13260-3427 structure.

Figure 1—figure supplement 1.

(A) Representative cryo-EM images from each of the three datasets presented in this work. White bar corresponds to 100 nm (B) Cartoon depicting a 13-protofilament microtubule with a seam. α-tubulin (dark green) an β-tubulin (light green) form a constitutive dimer that polymerises end-on-end as a protofilament. 13-protofilaments are arranged in a ring to create a tube. Lateral interactions are like-for-like (α-to-α and β-to-β, yellow arrow) except at the seam (red arrows). This asymmetry means conventional helical averaging cannot be performed. The dynein MTBD (magenta) binds to the intradimer interface. (C) Processing workflow for the cytoplasmic dynein-1 MTBD structure. Motion correction and CTF determination were performed as standard. Autopicking was optimised to pick all microtubules. 2D and 3D classification was used to remove bad particles. In 2D classification, bad classes included those with incorrect features (e.g. the carbon edge, class 2), low decoration on the side of the microtubule (class 4) or identifiable non-13 protofilament architecture (classes 6 and 9). The latter can be distinguished on account of the unique lack of protofilament twist in 13-protofilament microtubules (that is, protofilaments run exactly parallel to the microtubule long axis). This means that the repeating patterns in the classes should run parallel (class 7, expanded), whereas particles with protofilament twist will have converging or diverging patterns along the microtubule (class 6, expanded). This method is then supplemented with 3D classification to remove microtubule architectures with small protofilament skews that may not show up in short 2D segments, as well as particles with poor contrast or high-resolution detail. Refinement of the good class from 3D classification followed by 3D refinement with local symmetry resulted in a 4.1 Å map (FSC0.143 cut-off, gold standard). (D) Fourier shell correlation (FSC) curve for the refined SRS-DYNC1H13260-3427 structure. (E) Luminal view of the protofilament either side of the seam in the final C1 (asymmetric) and final symmetrized SRS-DYNC1H13260-3427 maps. α- and β-tubulin (dark and light green) can be differentiated by the length of the S9-S10 loop (dotted circles). In α-tubulin the loop is extended, whereas in β-tubulin it is short, making room for the taxol binding site (taxol in blue). The asymmetry at the seam is clearly defined in both the C1 and symmetrized map. (F) Exterior view of the protofilament either side of the seam in the final C1 (asymmetric) and symmetrized SRS-DYNC1H13260-3427 maps. MTBD density (magenta) undergoes an additional rise across the seam, reconfirming the definition of the seam.

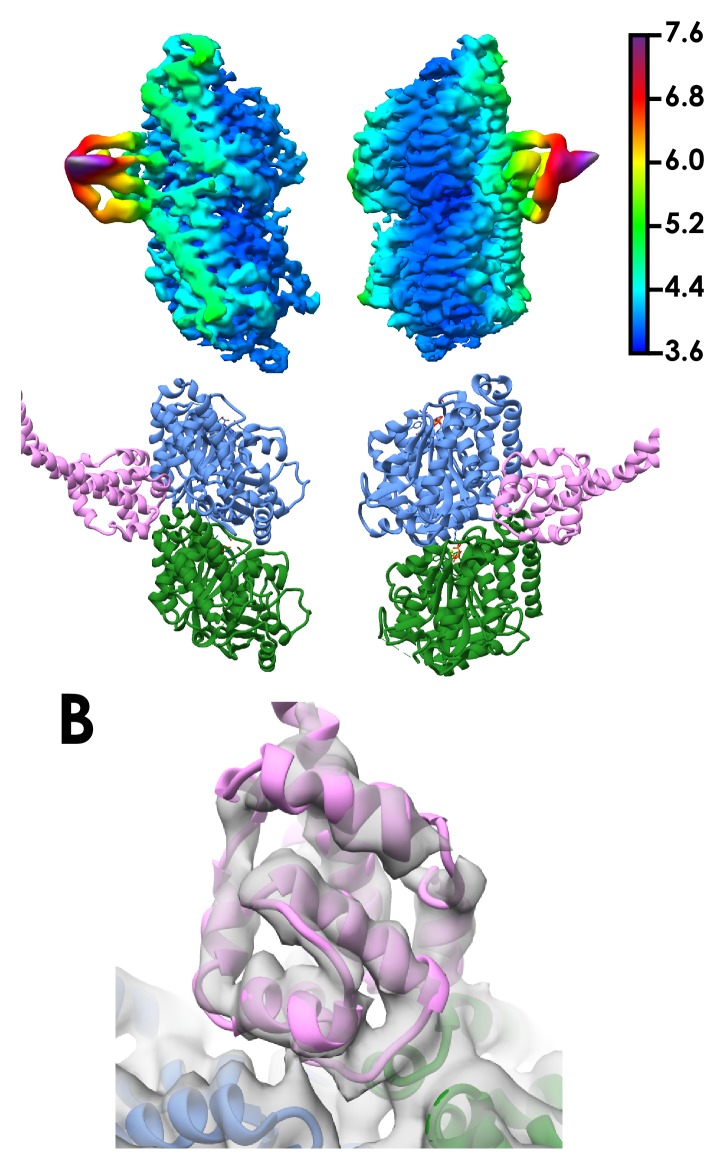
Figure 1—figure supplement 2. Local resolution of the cytoplasmic dynein-1 MTBD SRS structure.

Figure 1—figure supplement 2.

(A) Density corresponding to one tubulin dimer and the cytoplasmic dynein-1 MTBD coloured and filtered according to local resolution as determined in relion_postprocess. Density (top) and the corresponding views in the model (bottom) are shown. (B) Orthogonal view of Figure 1D, showing the refined cytoplasmic dynein-1 MTBD docked into density lowpass filtered to 5 Å.

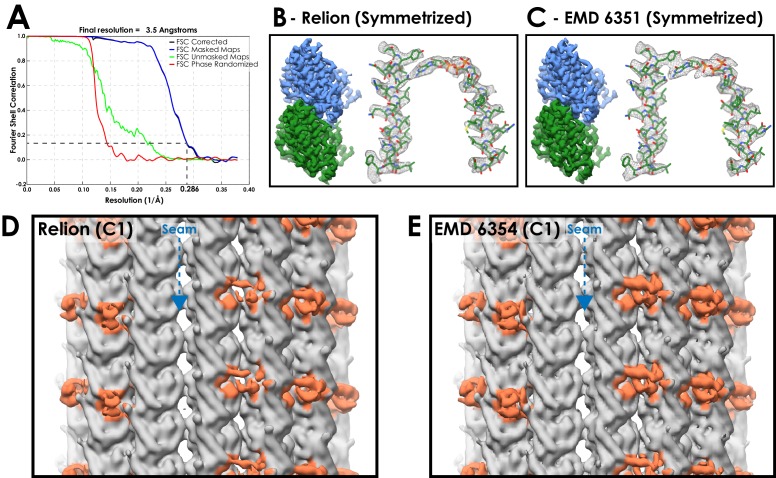
Figure 1—figure supplement 3. A comparison between microtubule reconstructions using Relion or previous methods.

Figure 1—figure supplement 3.

(A) FSC curves for EMPIAR dataset 10030 (EB3 decorated microtubules) processed in the Relion pipeline following symmetrization (FSC0.143 cut-off, gold-standard). (B) Density from the Relion refined EB3-microtubule dataset, following symmetrization. Mesh representation of alpha-tubulin H4 +H7 and nucleotide. (C) Corresponding views of the published map processed from the same dataset but refined with the seam-finding protocol (EMD 6351 - Zhang and Nogales, 2015). (D) Density at the seam of the C1 (asymmetric) reconstruction from Relion (EB3 density coloured blue). The EB3 density close to the seam is weak, suggesting that the seam is poorly aligned in some particles (E) Corresponding view of a C1 reconstruction using the seam-finding protocol refinement (EMD 6354). The EB3 density is as strong around the seam as in neighbouring protofilaments.