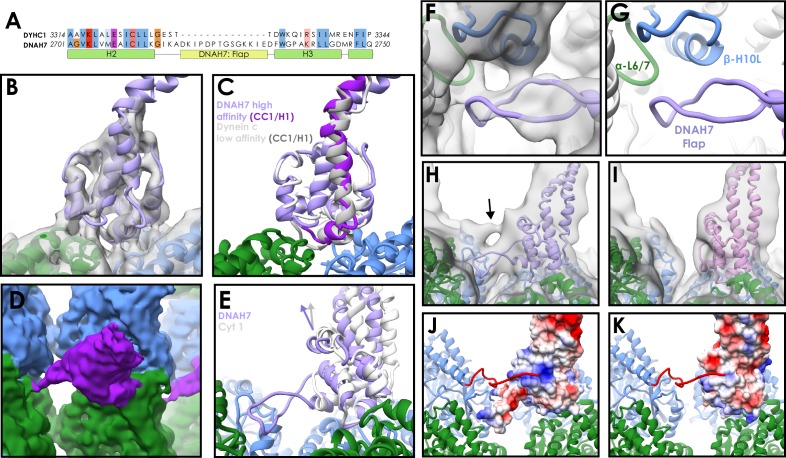
Figure 3. Structure of the DNAH7 MTBD.
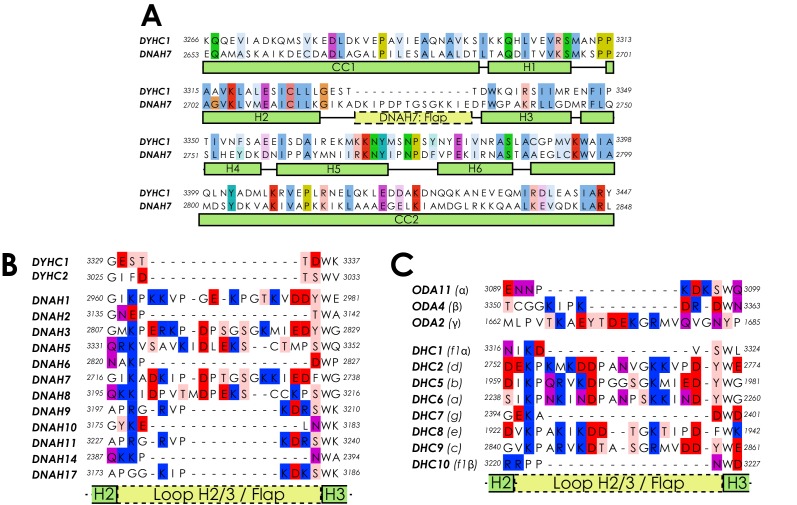
(A) Partial sequence alignment of human cytoplasmic dynein-1 (DYHC1) and human Axonemal Dynein 7 (DNAH7). DNAH7 has a 13-residue insert between H2 and H3 compared to cytoplasmic dynein called the flap. Full MTBD sequence alignment in Figure 3—figure supplement 1 (B) A model of DNAH7 (violet) was refined into the SRS+-DNAH72758-2896 cryo-EM density (grey, lowpass filtered to 5 Å). (C) A comparison between the microtubule-bound DNAH7 model (violet) and the low-affinity Flagellar dynein C NMR structure (Kato et al., 2014, 2RR7, ensemble chain 8, docked to the same density, white). As with cytoplasmic dynein, the only major conformational changes between the two is the upward movement of CC1/H1 (purple and grey for DNAH7 and 2RR7 respectively) (D) The SRS+-DNAH72758-2896 cryo-EM density (MTBD in purple, α-tubulin in green, β-tubulin in blue) thresholded at a low level, revealing the extension of the flap to contact the adjacent protofilament (E) Rotation of the DNAH7 MTBD relative to cytoplasmic dynein-1. The tubulin was aligned in the cytoplasmic and axonemal dynein models. This reveals a rotation around the base of H6/CC2 towards the adjacent protofilament in DNAH7 (violet) compared to cytoplasmic dynein-1 (white). (F) Close-up view of the flap of the DNAH7 MTBD model with its corresponding density. (G) Corresponding view to F, without the electron density. (H) The DNAH7 map lowpass filtered to 10 Å reveals a new connecting density that cannot be explained by the flap (DNAH7 model docked, violet). (I) The extra density observed in H is not seen in the cytoplasmic dynein-1 density filtered to the same resolution (J) The C-terminal tail of β-tubulin could potentially explain the density in H, given its length and possible binding site in a positively charged pocket on the top surface of DNAH7 (surface coloured by coloumbic potential) (K) Cytoplasmic dynein-1 (surface coloured by coloumbic potential) does not have the same positive patch on DNAH7, suggesting that the C-terminal tail would not dock in the same way.


