. 2019 Jun 28;8:e46041. doi: 10.7554/eLife.46041

Figure 2. The C-terminal tail of rhodopsin.

(A) The EM map is contoured at two different levels to show the continuity of the density. The weakening at the end of H8 may arise from impaired interactions of the receptor with the detergent micelle (Glukhova et al., 2018). TM7, H8 and the C-tail of the receptor are colored in blue, Gα in green, Gβ in yellow, and Gγ in magenta. (B) Conformational change of the C-tail between three different conformational states of rhodopsin: Inactive state (left, PDB id: 1U19), G protein-bound (center, this work), and arrestin-bound (right, PDB id: 5W0P, chain A). The Cα atoms of residues Asp330, Glu332 and Ser334 are shown as orange spheres to help tracking the structural changes in the C-tail. All structures are aligned to rhodopsin. (C) Schematic representation of the rhodopsin C-tail from Cys322 to Ala348. On the left, colored bars indicate the portion of the C-tail visible in this structure (green), and in the arrestin-bound structure (salmon) (PDB id: 5W0P). On the right, the residue-residue contacts between rhodopsin C-tail and Gα (marked in green), Gβ (yellow), and arrestin (salmon) within 4 Å distance are indicated. Thr336 and Ser338 are phosphorylated in the arrestin-bound structure. The predicted phosphorylation sites are marked with red dots. (D) Model of residue-residue interaction between the rhodopsin C-tail and the G protein subunits. AsnH3.15 and LysH3.16 of the Gαi subunit forms the contact to the C-tail of rhodopsin near Glu332, Ala333 and Thr 335. In this model, the surface region of blades 6 and 7 of Gβ contact the C-tail via hydrophilic residues Cys271, Asp290, Asp 291, and Arg314.

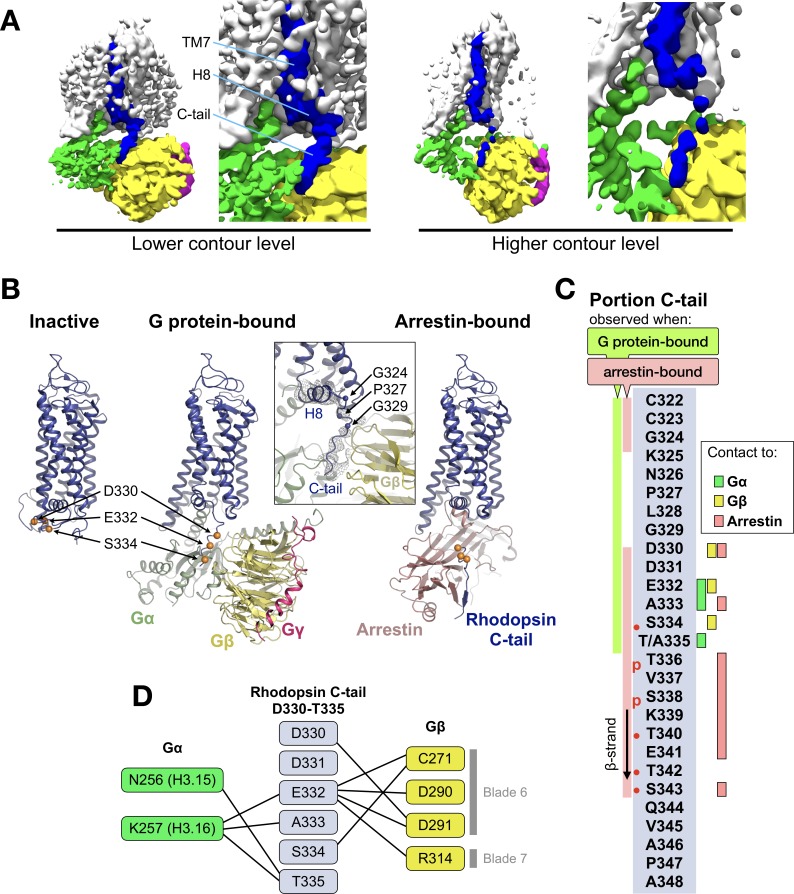
Figure 2.

Figure 2—figure supplement 1. Electrostatic potential.

Figure 2—figure supplement 1.

(A) Three-dimensional structure of the rhodopsin (blue) - Gα (green) – Gβγ (yellow and magenta) complex. The alpha carbons of the interacting residues in each component are displayed as spheres. (B) Detail of the interacting region between the receptor C-tail and the G protein. (C) Electrostatic potential mapped on the surfaces of Gα (positive near the receptor C-tail, black circle) and Gβγ (negative, white circle). (D) Electrostatic potential mapped on the surfaces of the receptor, Gα, and Gβγ.
Figure 2—figure supplement 2. Sequence conservation in Gα and Gβγ.

Figure 2—figure supplement 2.

(A) Sequence logo depicting the sequence conservation in the α3 helix of the Ras domain in different G protein subtypes. The size of the letters represents frequency within a sequence alignment of mammalian Gα proteins. Residues at positions H3.15 and H3.16, which can potentially interact with the C-tail of the receptor, are highlighted in yellow. (B) Alignment of residues C271, D290, and D291 in blade six and R314 in blade 7 of the β-propeller in the five human Gβ subtypes.
Figure 2—figure supplement 3. Flexible fitting of the C-tail in the electron density.

Figure 2—figure supplement 3.

Structural model of rhodopsin displaying the electron density at a 10σ cuf-off around H8 and the C-tail (left), and snapshots of this region during the MDFF simulation (right).
Figure 2—figure supplement 4. Structure of the C-tail in rhodopsin and M1R.

Figure 2—figure supplement 4.

(A) Three-dimensional structure of the rhodopsin (blue) - Gαi (green) – Gβ (yellow) complex. (B) Three-dimensional structure of the M1 muscarinic acetylcholine receptor (blue) – Gα11 (green) – Gβ (orange) complex. (C) Structural superposition of the complexes.