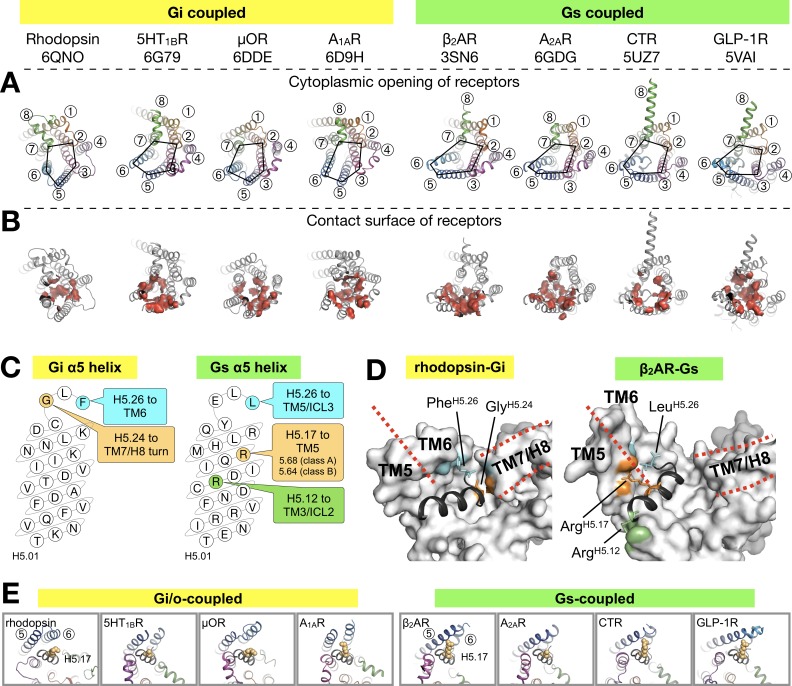
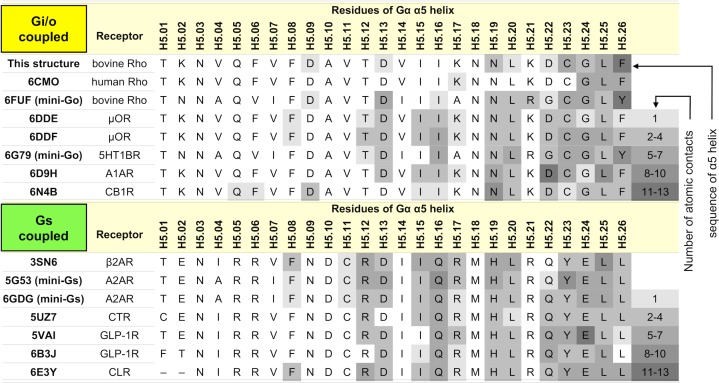
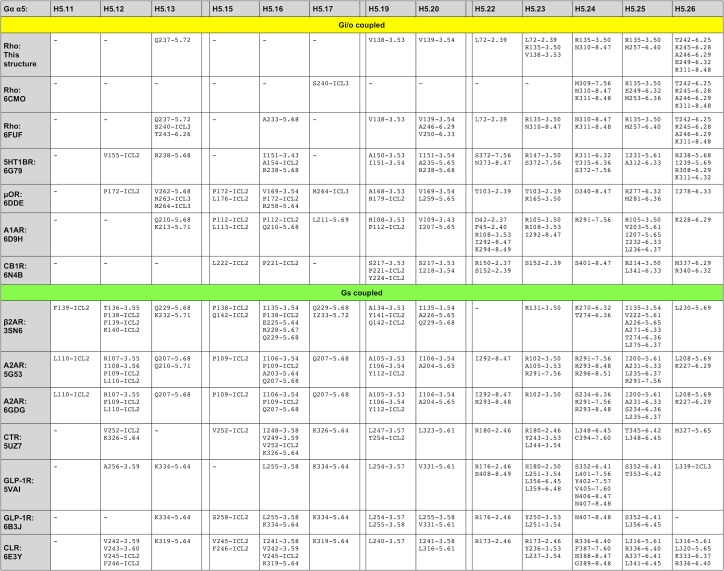
Figure 3. Binding of the Gα α5 helix in GPCR-G protein complexes.
(A) Overview of a subset of GPCR-G protein complexes used for this analysis. For a complete list of the complexes used, see Figure 3—figure supplement 2. The complexes are shown from the cytoplasmic side, and the black pentagons connecting TM2-3-5-6-7 delineate the G protein-binding interface. Receptors are represented in ribbons with their TM helices numbered. (B) The red surfaces depict the contact area (within a distance of 4 Å) between the receptor and the α5 helix of Gα (C) Schematic representation of the α5 helix in Gi- and Gs-subtypes. The residues highlighted, and their respective binding site to the receptor, are conserved among all Gi, and Gs, complexes analyzed. All contacts retrieved from this analysis are reported in Figure 3—figure supplement 2. (D) Position of Gi- and Gs-specific contacts shown in the rhodopsin-Gi (this work, PDB id: 6QNO) and the β2AR-Gs (PDB id: 3SN6) complexes. The cytoplasmic side of the receptors is depicted as gray surface. Red lines mark the border between TM5 and TM6 and delineate H8. (E) Cytoplasmic view of GPCR-G protein complexes showing the interaction between H5.17 (orange spheres) and TM5 and TM6. From left to right, the structures (PDB ids) correspond to: this work, 6G79, 6DDE, 6D9H, 3SN6, 6GDG, 5UZ7, and 5VAI. Throughout the analysis, contacts are defined as atomic distances smaller than 4 Å.


