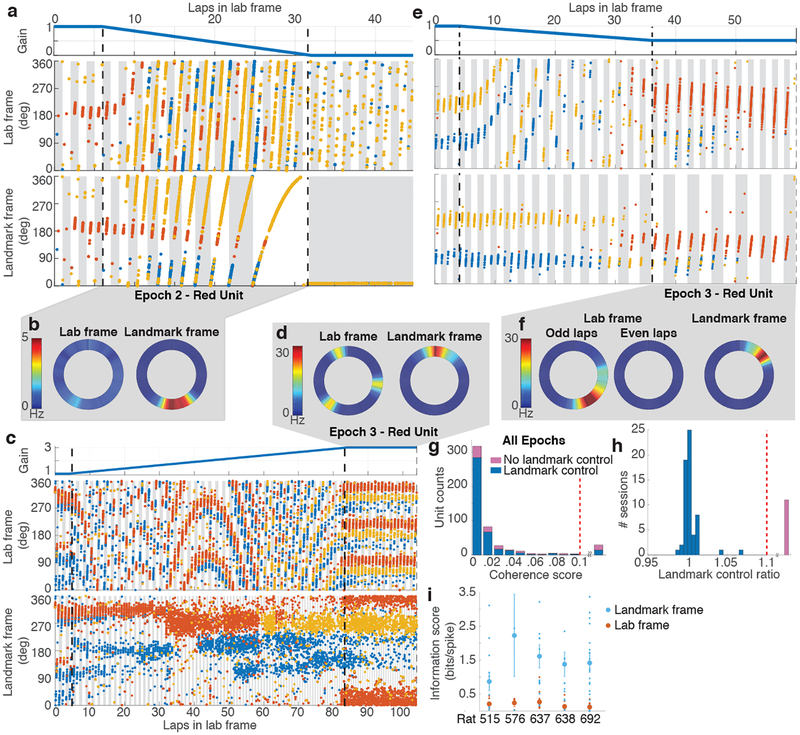
Figure 2 |. Control of place fields by landmarks.
a, (top) Profile of experimental gain, G, for Epochs 1–3 of a session where Gfinal was 0. (middle) Colored dots show the location of the rat in the lab frame (y axis) as a function of cumulative distance traveled on the track (x axis) when spikes from 3 units (red, blue, yellow) were recorded. Alternate gray and white bars indicate laps in this frame. (bottom) The same spikes in the landmark frame. Alternate gray and white bars indicate laps in this frame. The yellow unit fired weakly during the first 8 laps, became stronger on laps 9–10, and maintained the strong field in the landmark frame throughout the remainder of the session. During the last landmark-frame lap, the unit fired in a field that spanned ~1080° (3 laps) in the lab frame (middle). b, Rate maps of the red unit in lab and landmark frames for Epoch 2 of the trial shown in (a). The firing rate is low and diffusely distributed (on average) in the lab frame, whereas there is a well-defined place field in the landmark frame. c, Epochs 1–3 of a session where the Gfinal was 2 (same format as (a)). In Epoch 3, all three units maintain normal spatial firing in the landmark reference frame, but they have 3 fields/lap, separated by 120°, in the lab frame. d, Rate maps of the red unit for Epoch 3 of the trial shown in (c). e, Epochs 1–3 of a session where the Gfinal was 0.5. Remapping occurred near the transition between Epoch 2 and Epoch 3, as the previously silent red unit became active and maintained a stable place field in the landmark frame. In the lab frame, however, the unit fired every other lap, (i.e., it was active on the gray laps and silent on the intervening white laps). f, Rate maps for the red unit for Epoch 3 of the trial shown in (e). Separate rate maps are shown for the odd- and even-numbered laps in the lab frame. g, Coherence of the population response. The n = 500 units acted as a coherent population in sessions with (blue, 411/500) and without (pink, 89/500) landmark control (see panel h). Units with coherence score above 0.1 (range 0.12 – 0.47) were combined in a single bin (29/500 units). These cells generally displayed poor spatial tuning and therefore did not admit a reliable estimate of hippocampal gain. h, Landmark control ratio. In most sessions (blue, 60/72), the landmark control ratio was ~ 1. Sessions with gain ratio above 1.1 (range 1.16 – 4.02) were combined in a single bin (pink, 12/72). i, Spatial information scores in the lab and landmark frames for each rat (sessions with n = 12, 3, 17, 15, 29 units) are significantly different (two-sided paired t-test, n = 5 rats, t4 = 6.213, p = 0.0034). Small dots represent scores from individual units. Mean (large dots) ± s.e.m. are shown.

