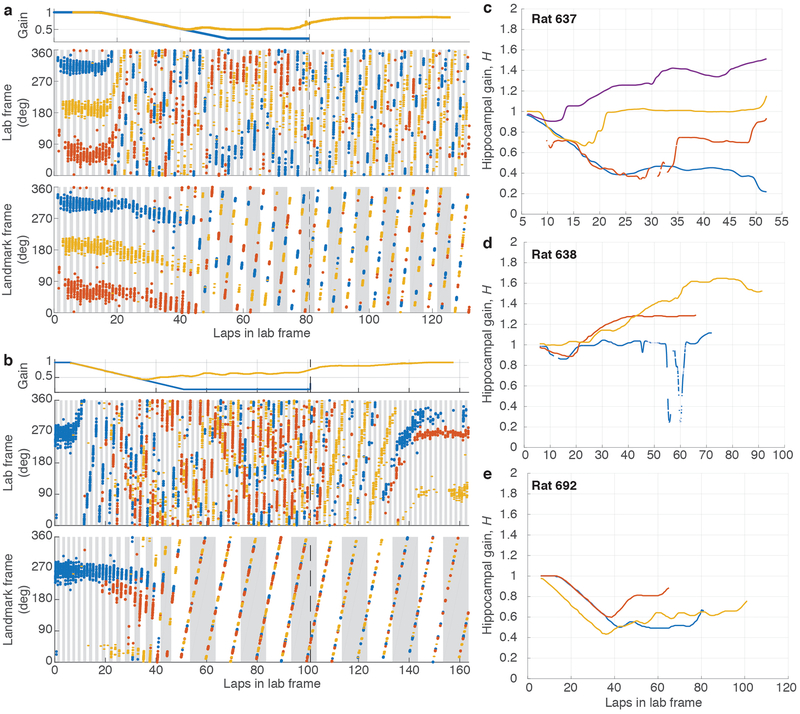
Extended Data Figure 2: Examples of failure of landmark control.
a, (top) Experimental gain, G (blue), and hippocampal gain, H (yellow), for Epochs 1–3 of a session where Gfinal was 0.231. Note that the two curves overlap until ~lap 40, when they start to diverge. (middle) Spikes from three putative pyramidal cells (colored dots) in the lab frame. Alternate gray and white bars indicate laps in the lab frame. (bottom) The same spikes in the landmark frame. At the point of landmark control failure, the place cells stop firing at a particular location in the landmark frame, and instead start drifting in both lab and landmark frames. Alternating gray and white bars indicate laps in the landmark frame. b, Second example, from a different animal, for a session where Gfinal was 0.1 (same format as (a)). c-e, Trajectory of hippocampal gain, H, for three rats for all sessions where landmark control failed. The hippocampal gain generally starts near 1 and then diverges from the experimental gain trajectory (not shown) during the session.

