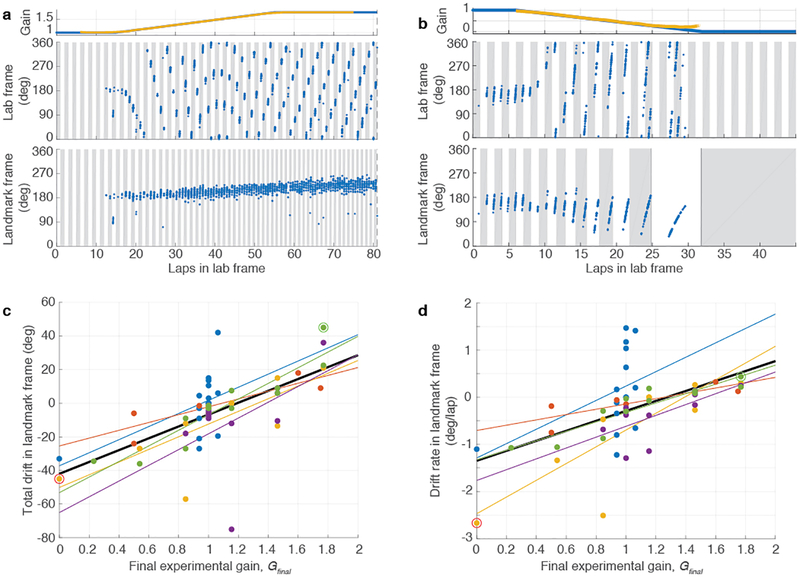
Extended Data Figure 5: Slow drift of place fields against landmarks.
a, Example of positive drift. (top) Experimental gain, G (blue), and hippocampal gain, H (yellow), for Epochs 1–3 of a session in which Gfinal was 1.769. There is no H (yellow) in the first or last 6 laps due to the 12-lap sliding window. (middle) Spikes from one putative pyramidal cell (blue dots) in the lab frame. Figure format is the same as in Figure 2. (bottom) The same spikes in the landmark frame. The unit was silent for the first 12 laps but developed a strong place field in the landmark frame that slowly drifted in the same direction as the animal’s movement over the course of the session. b, Example of negative drift from a session in which the Gfinal was 0. In the landmark frame, the slow drift was in the direction opposite to the animal’s movement direction. Note that the unit was completely silent in Epoch 3, because the rat was not in the place field of the unit as G reached 0. c, Drift over the entire session vs. Gfinal. Each point represents an experimental session. Linear fits are shown for each individual rat (colored lines) and for the combined data (black line; n = 55 sessions, Pearson’s r53 = 0.64, p = 1.5 × 10⁻⁷). The two example sessions of (a) and (b) are shown with the circled markers. d, Drift rate vs. Gfinal. Although the magnitude of drift is correlated with the final experimental gain (Gfinal), as shown in (c), a confound is present because the ramp duration in Epoch 2 depends on the value of Gfinal (e.g., for G > 1, the larger Gfinal is, the more laps required to ramp G up to that value). It is thus possible that the correlation between the total drift and Gfinal is due to the differences in Epoch 2 duration (and, in some experiments, Epoch 3 duration) rather than due to different rates of drift that depend on G. To control for the effect of trial duration, we calculated drift rate by dividing the total drift by the total number of laps in the landmark frame over which the drift was computed. Linear fits are shown for each individual rat (colored lines) and for the combined data (black line; n = 55 sessions, Pearson’s r53 = 0.54, p = 1.9 × 10⁻⁵). The two example sessions of (a) and (b) are shown with the circled markers. These results show that the drift rate was related to the value of Gfinal.

