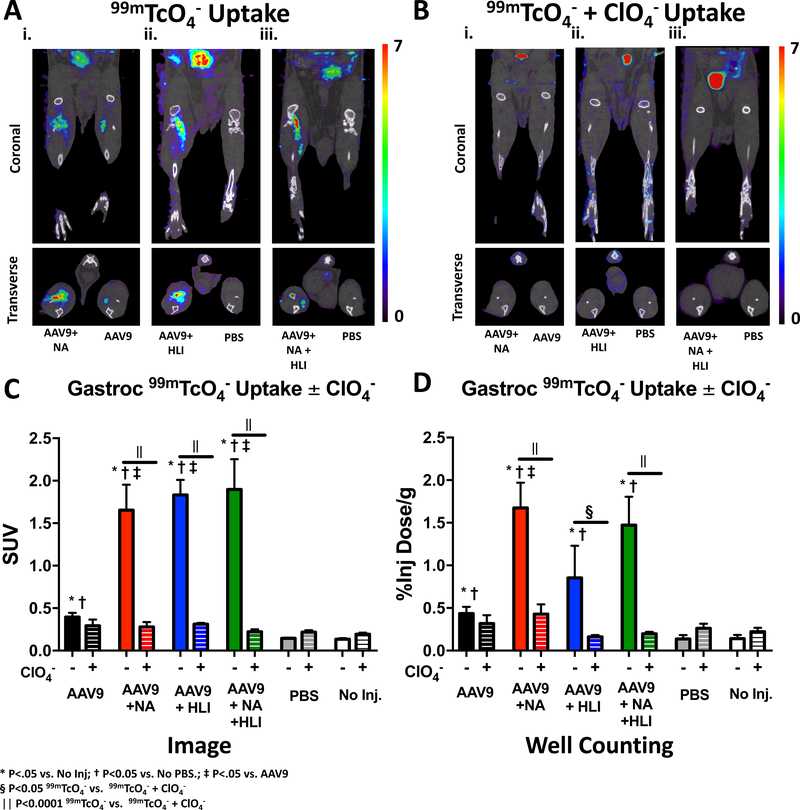
Figure 4: NIS-mediated 99mTcO4− uptake in the gastrocnemius is inhibited by perchlorate (ClO4−).
A) Representative coronal and transverse microSPECT/CT images of 99mTcO4− uptake on day 10 following NA and AAV9-hNIS co-injection into the right hind-limb and injection of AAV9-hNIS alone into the left leg (i); a mouse injected with AAV9-hNIS into ischemic right hind-limb and injected with phosphate buffered saline (PBS) in left hind-limb (ii.); and a mouse injected with AAV9-hNIS + NA into ischemic right hind-limb and injected with phosphate buffered saline (PBS) in left hind-limb (iii.). B) Same as A, except that 99mTcO4− was co-administered with ClO4−. C) Quantitative analysis of differences in gastrocnemius 99mTcO4− uptake derived from microSPECT/CT images in mice without (−) and with (+) co-administration of ClO4−. D) Quantitative analysis of differences in gastrocnemius 99mTcO4− uptake in mice without (−) and with (+) co-administration of ClO4− derived from ex vivo gamma well counting. Image quantification and display are the same as in Figure 3. For gamma well counting, tissue activity is displayed as the ratio of gastrocnemius 99mTcO4− activity (% ID/g). * = P < 0.05 vs. no injection, †= P< 0.05 vs. PBS injection and ‡= P<0.05 vs. AA9-hNIS injection. § =P<0.05 within group difference between mean99mTcO4− gastrocnemius uptake with and without ClO4−; || =P<0.0001 within group difference between mean99mTcO4− gastrocnemius uptake with and without ClO4−.

