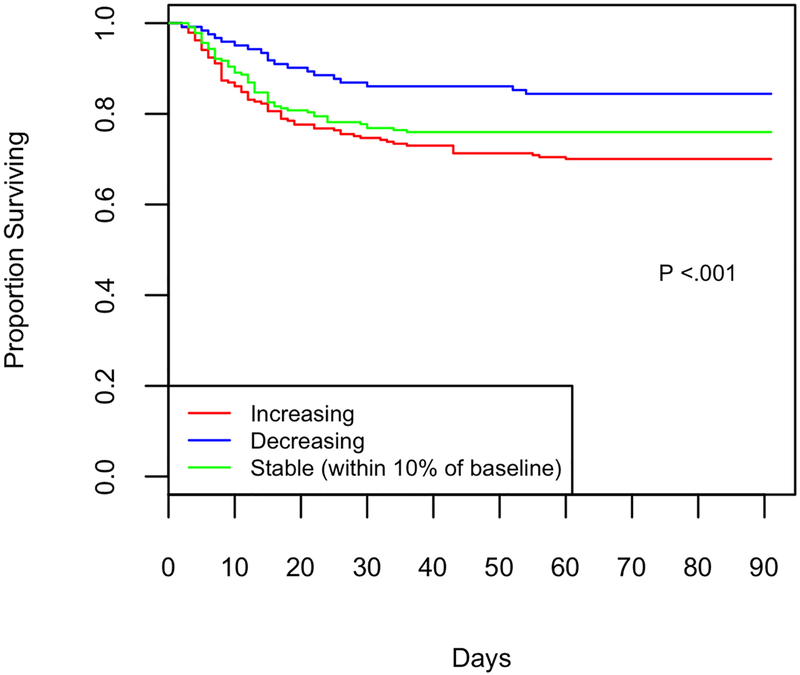
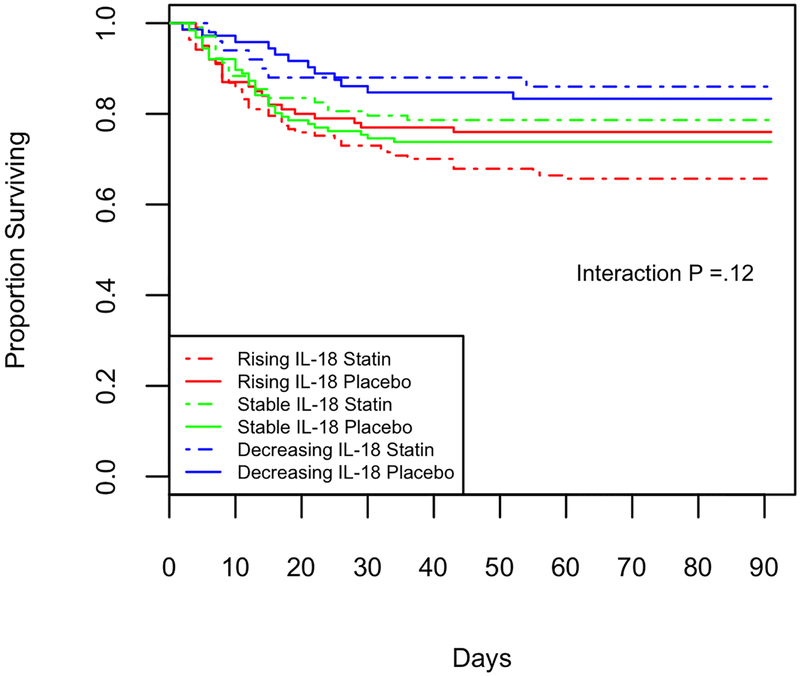
Figure 2:
Survival grouped by day 3 IL-18 trajectory, Kaplan-Meier curve of survival from enrollment (day 0) to Day 90. Change characterized as increasing IL-18 (red, N=237), stable (green, within 10% of baseline, N = 229), falling (blue, N= 122). 2A: Mortality is highly associated with change in IL-18, (Chi squared p <.001). 2B: Subjects randomized to statin are shown with a dashed line, those randomized to placebo with a solid line. Mortality is highly associated with change in IL-18, and there is no detectable interaction by treatment group (p=.12).


