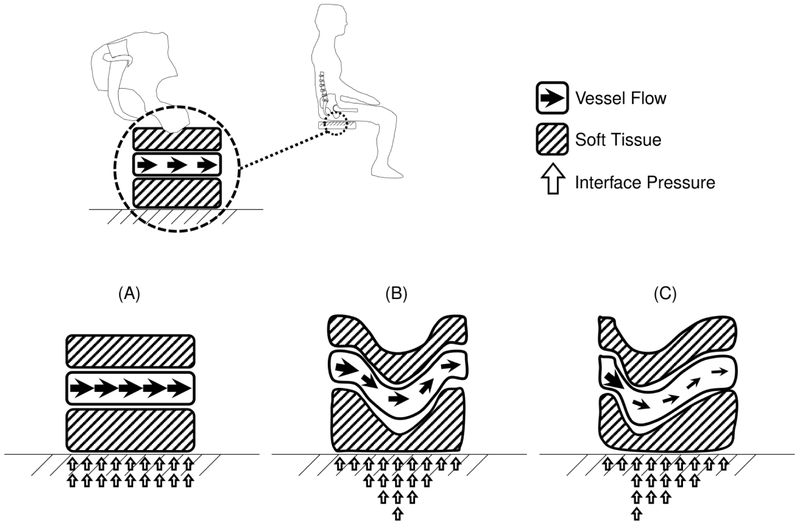
Figure 2.
A conceptual schematic of three ischial tuberosity pressure distributions. Although these distributions have similar average pressures, they have distinct peak pressure gradients: (A) zero, (B) medium, and (C) high. Peak pressure gradients may affect pressure ulcer development by impacting blood flow, as well as localized tensile and shear stresses.

