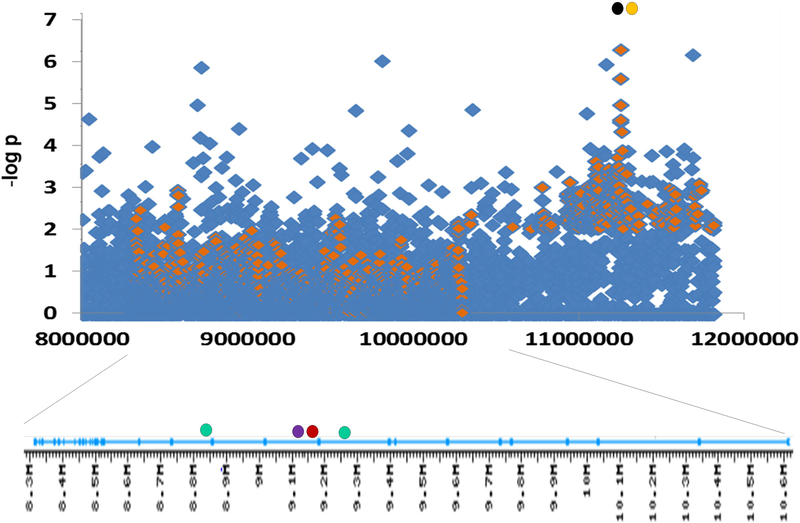
Figure 2.
Associations at PTPRD locus (top) and PTPRD introns (bottom) (Manhattan plot). Diamonds: –log P values for addiction-related phenotypes: smoking cessation success (blue; Uhl et al., unpublished observations) and positive responses to amphetamine (orange; data kindly provided by A. Hart). Filled circles: Intron positions of SNPs most strongly associated with RLS (green), levels of brain PTPRD mRNA expression (red), and neurofibrillary tangle density in Alzheimer’s disease brains (purple), and positions of SNPs most strongly associated with mood lability (orange) and obsessive-compulsive disorder (black). Left is telomeric and 3’, including the most 3’ exon encoding the 3’ untranslated region. Right: 5’ exons 1–12 encode the 5’ untranslated region of common adult brain transcripts.

