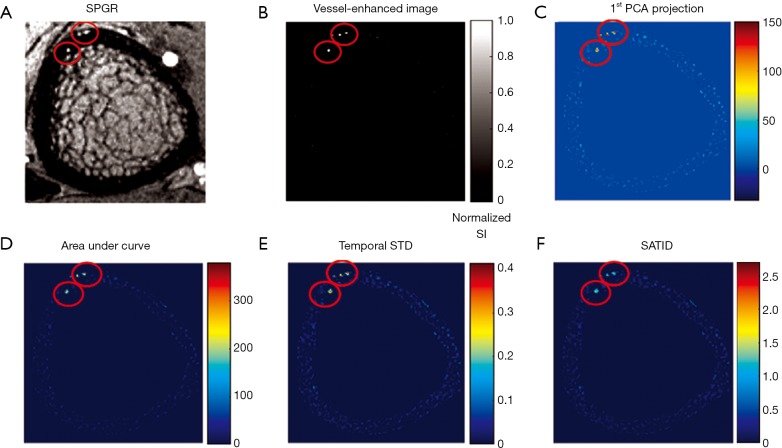
Figure 5.
Example SPGR image and feature maps: (A) SPGR image at middle time point (B) vessel-enhanced image (C) first PCA projection (D) area under curve (E) temporal standard deviation (F) SATID. These images demonstrate that voxels representing vessels (red circles) enhance on DCE-MRI and have high values on feature maps. SPGR, spoiled gradient-recalled; PCA, principal component analysis; SATID, summation of absolute temporal intensity difference.

