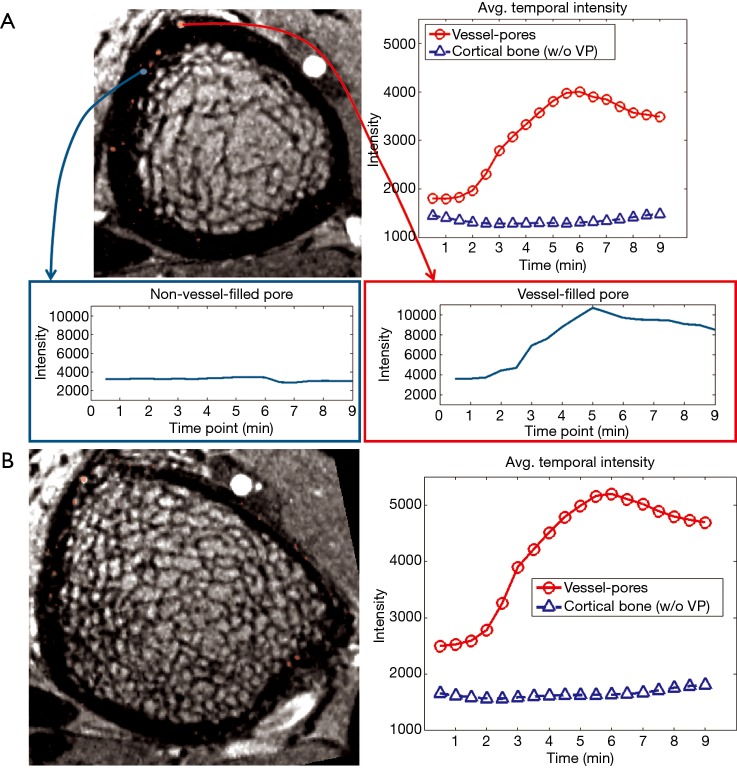
Figure 8.
Representative MRI images and graphs demonstrating the vessel detection algorithm: (A) distal tibia (B) ultra-distal tibia. Detected vessel-filled pores displayed enhancement (red box), while non-vessel filled pores did not (blue box). The mean intensity of detected vessel-filled pores (red line) also increased over the acquisition period. The mean intensity of voxels within the cortical bone boundaries excluding the detected vessel-filled pores (blue line) remained unchanged. MRI, magnetic resonance imaging.

