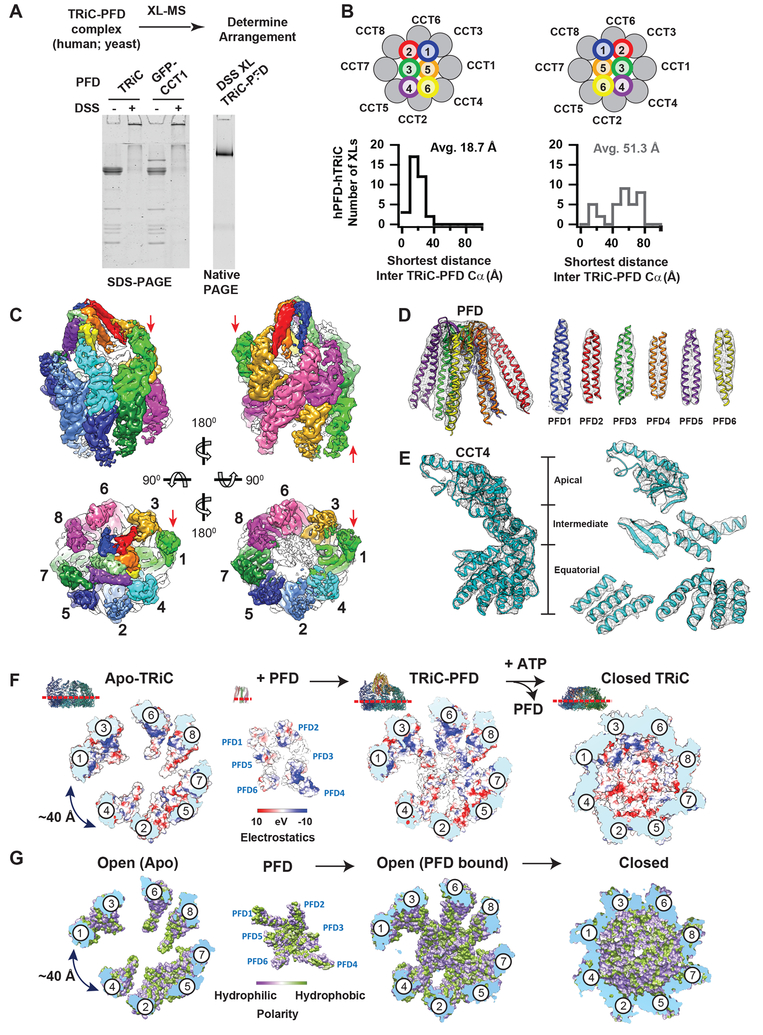
Figure 5. TRiC and PFD interact in a subunit specific manner.
(A) DSS crosslinked TRiC–PFD analyzed by SDS-PAGE and Native-PAGE. (B) Histograms of Cα-Cα distances establish the correct arrangement of the PFD subunits: XLs mapped onto TRiC–PFD models with the two possible PFD subunit arrangements determined from PFD alone XLs show one conformation has a much smaller average XL distance (18.7 vs 51.3 Å) consistent with the ~ 24 Å DSS length. (C) CryoEM map of Class 6 showing overall architecture of TRiC- PFD complex. CCT1–8 and PFD1–6 subunits are shown in different color codes and red arrows indicate the location of protruding TRiC subunit (CCT1). (D) Ribbon diagram of PFD into segmented PFD density to show the map and model quality. (E) Segmented CCT4 subunit is shown as a representative for the quality of the map and model. (F) Surface electrostatic distribution and (G) Hydrophobicity distribution inside of TRiC chamber at the viewpoint from equatorial to apical domains.

