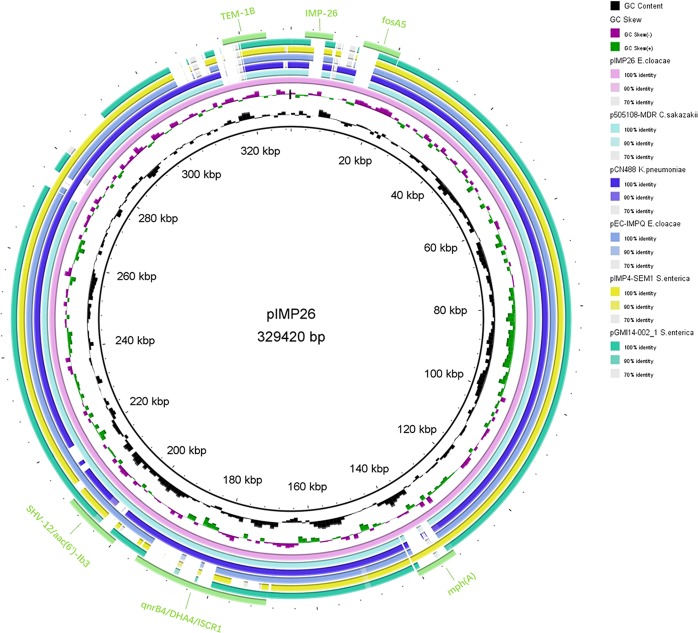
Figure 2.
Circular map of plasmid pIMP26. The two inner circles represented the G + C content plotted against the average G + C content of 48.24% (black circle) and GC skew information (green and purple circles). Circles in different colors represented different plasmids (details in the legend), and the Genbank numbers were as follows: pIMP26 (MH399264), p505108-MDR (KY978628), pCNR48 (LT994835), pEC-IMPQ (EU855788), pIMP4-SEM1 (FJ384365), and pGMI14-002 (CP028197). The location of discussed resistance genes and intI were also demonstrated on the outer cyan-blue circle. The annotation of the genetic components were added manually using the Microsoft PowerPoint 2016 program.

