Figure 2.
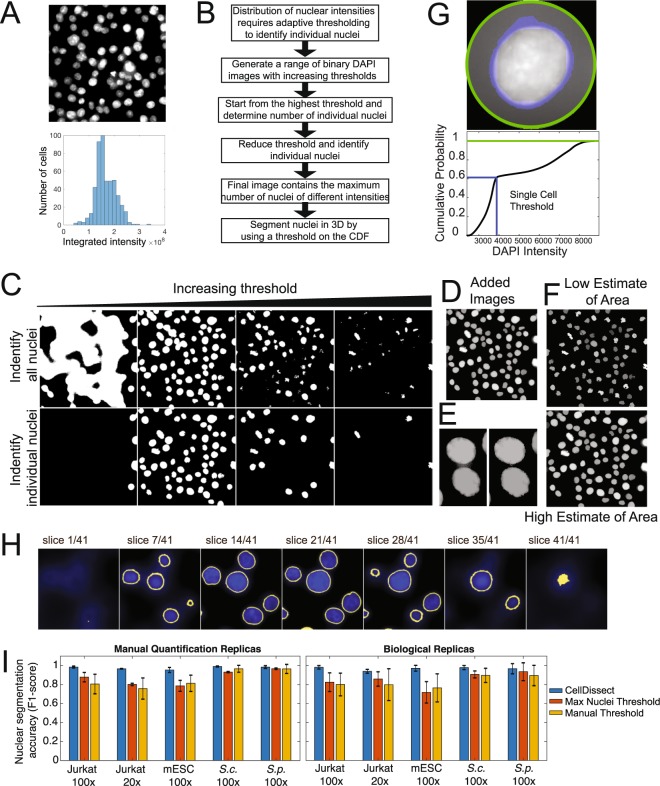
Automated nuclear segmentation of 3D image stacks. (A) Maximum projected cell nuclei with variable DAPI intensities (top). Distribution of integrated DAPI intensities within an image (bottom). (B) Workflow of the nuclear segmentation code after providing cell type-specific definitions of minimal and maximum nuclear area. (C) Increasing threshold result in an increase and then decrease in connected regions (top row). Binary images from the top are analyzed for connected regions within a cell type specific size range (bottom row). (D) Threshold binary images in the top row are added resulting in a pseudo image of large and small connected regions (Added Images). (E) Separation of connected objects before and after individual investigation of nuclei to maximize objects fitting size parameters. (F) Low and High estimate of nuclear area after watershed algorithm labels individual nuclei resulting in segmented nuclei. (G) Boundary of the nucleus is determined individually by first radially identifying the fluorescent intensity of pixels in and around the nucleus (top, green circle). For each cell a threshold in the maximum cumulative fluorescent intensity (blue line) was determined using the High estimate of nuclear area to robustly identify the nuclear boundary in 3D across all cell types and imaging conditions (bottom). (H) Nuclear segmentation in 3D from the bottom to top presented as series of images. (I) Nuclear segmentation accuracy (F1-score) quantification of 3D nuclear segmentation comparing fully automated adaptive threshold algorithm CellDissect (blue), maximum nuclei threshold algorithm (orange) and manual thresholding (yellow) in comparison to manual segmentation in four different cell lines and two different imaging magnifications. Mean and standard deviations are computed from quantifying 3–4 images by three independent human experts (left) or 3 replicas by one human expert (right).

