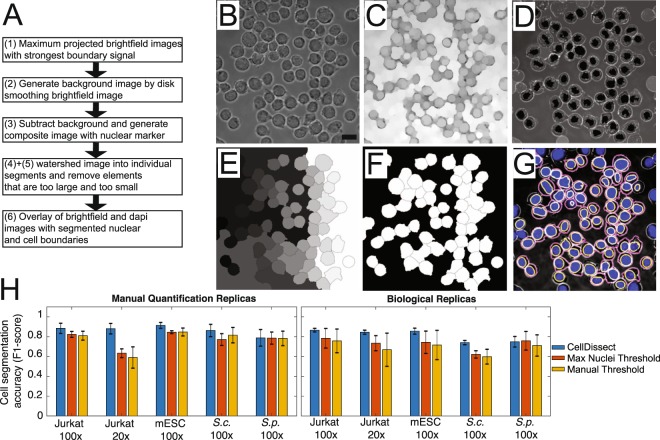
Figure 3.
Automated cell boundary segmentation. (A) Workflow of the automated cell boundary segmentation. (B–G) Images showing individual processing steps: (B) Maximum projected widefield image using several images with clear cell boundaries is used to generate a (C) background image using disk smoothing. (D) After background subtraction, the maximum projected widefield image is overlaid with the segmented nuclei. (E) A watershed algorithm is applied resulting in segmented cells with cells on the image boundary removed (F). (G) Overlay of widefield (grey), DAPI (blue), nuclear (yellow) and cytoplasmic (magenta) segmented mESC. Scalebar 13.3 µm (H) Cell segmentation accuracy (F1-score) quantification of 2D cell segmentation comparing fully automated adaptive threshold algorithm CellDissect (blue), maximum nuclei threshold algorithm (orange) and manual thresholding (yellow) in comparison to manual segmentation in four different cell lines and two different imaging magnifications. Mean and standard deviations are computed from quantifying the 3–4 images by three independent human experts (left) or 3 replicas by one human expert (right).

