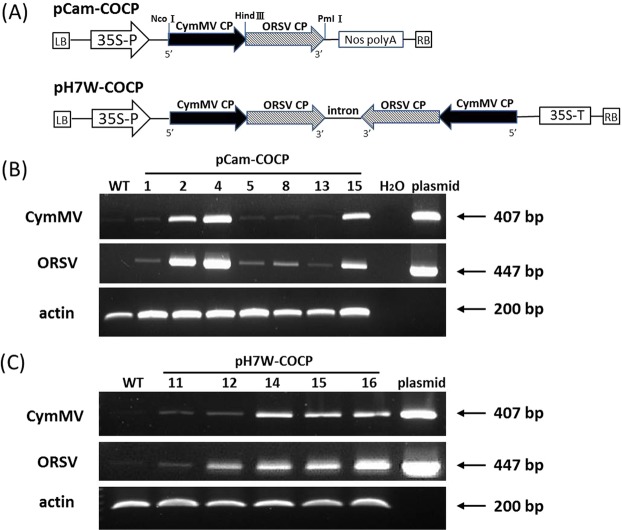
Figure 1.
Physical map and analyses of transgenes in transgenic lines. (A) Schematic representation of pCam-COCP and pH7W-COCP constructs used for N. benthamiana transformation. (B,C) RT-PCR analysis of transgene expression in WT and transgenic pCam-COCP lines (B) and pH7W-COCP lines (C). The CymMV CP transcripts were detected by primer pair CyCP3 and CyCP6 with an expected size of 407 bp and ORSV CP transcripts by primer pair ORSV3 and ORSV4 of 447 bp. Plasmids pCam-COCP and pH7W-COCP were used for positive controls. The numbers on top of gel tracks indicate different transgenic lines. H2O and actin are negative and internal controls, respectively.

