Fig. 6.
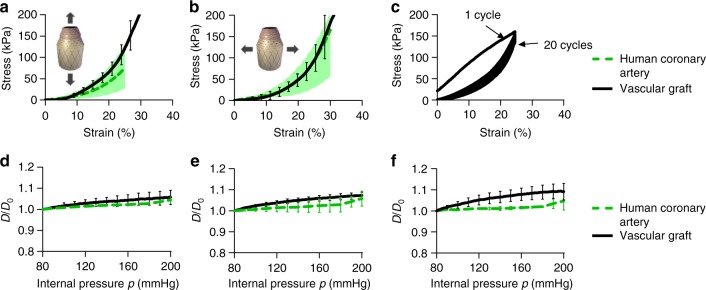
Mechanical evaluation of the fabricated small diameter vascular graft (SDVG). a, b Stress–strain curves of the SDVG (black line) and the human coronary artery in a longitudinal and b circumferential stretching directions (n = 5 independent experiments). The green dashed lines and green shaded zones in a and b represent average and value range, respectively35. The green shaded zones represent the range of results obtained for native human coronary arteries35. c Cyclic tensile testing in the circumferential direction. d–f Profiles of diameter change ratio (D/D0) as function of pressure applied to the SDVG (black line, n = 5 independent experiments) compared with human coronary arteries (green dashed lines, n = 5 independent experiments)34,35 at three different values of axial pre-stretch during testing (ez). d ez = 10% of axial pre-stretch. e ez = 20% of axial pre-stretch. f ez = 25% of axial pre-stretch. Error bars = standard deviation

