Fig. 1.
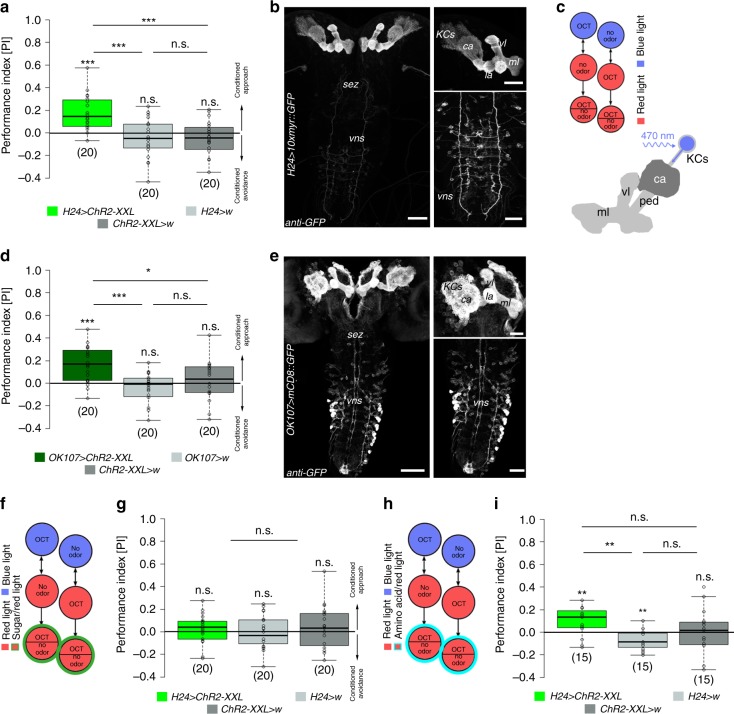
Optogenetic activation of KCs induces reward memory formation. a Conditional optogenetic activation of KCs coupled to odor information during training is sufficient to induce an appetitive memory using H24-Gal4. b Expression pattern of H24-Gal4 crossed with 10xUAS-myr::GFP stained with anti-GFP (white). H24-Gal4 shows expression in almost the complete set of MB KCs and a few additional cells of the vns. c Illustration of the 1-odor reciprocal training regime used in this study (substitution learning) and a schematic drawing of the larval MB expressing ChR2-XXL in KCs. d Conditional optogenetic activation of KCs coupled to odor stimulation during training is sufficient to induce appetitive memory expression (OK107 > ChR2-XXL). e Expression pattern of OK107 > mCD8::GFP stained with anti-GFP (white). f Schematic drawing of KC-substitution learning using a sugar test plate (green circle). g Appetitive memory expression in H24 > ChR2-XXL larvae is abolished during KC-substitution learning when larvae are tested on a sugar plate. h Schematic drawing of KC-substitution learning using an amino acid test plate (cyan circle). i Appetitive memory expression in H24 > ChR2-XXL larvae is unaffected during KC-substitution learning when larvae are tested on an amino acid test plate. ca: calyx; ChR2-XXL: channelrhodopsin2-XXL; KCs: Kenyon cells; la: lateral appendix; ml: medial lobe; 10xmyr::GFP: 10xUAS-myristoylated green-fluorescent protein; OCT: octanol; ped: peduncle; sez: subesophageal zone; vl: vertical lobe; vns: ventral nervous system; w: w1118. The number below the box plots refers to the N number. A pairwise Student’s t test or pairwise Wilcoxon test (both including Bonferroni-Holm correction) was used. Significance levels: n.s.p > 0.05, *p < 0.05, **p < 0.01, ***p < 0.001. Scale bars: 50μm and 25 μm for higher magnifications. Data are mainly presented as box plots, with 50% of the values of a given genotype being located within the box, and whiskers represent the entire set of data. No data were excluded. Outliers are indicated as open circles. The median performance index is indicated as a thick line within the box plot

