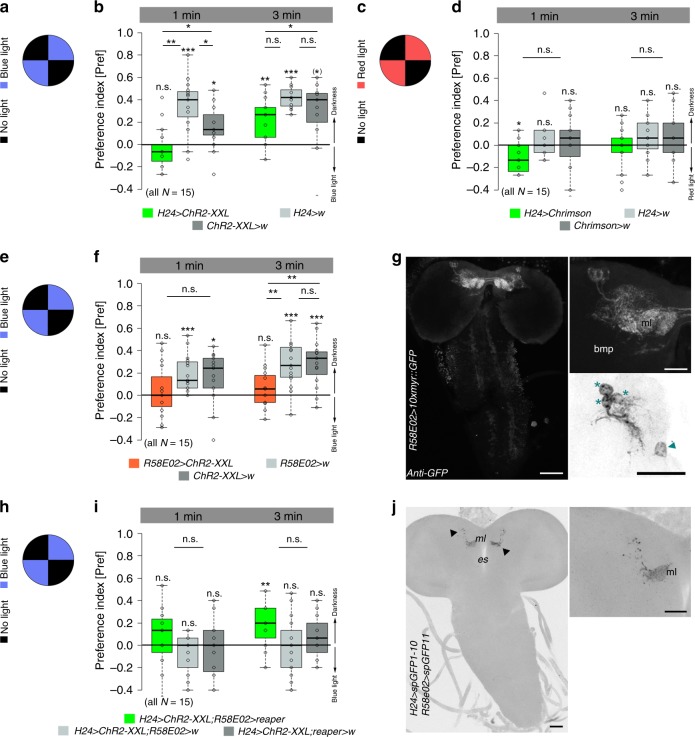
Fig. 3.
Optogenetic activation of KCs induces internal reward signaling. a, b Control larvae showed blue light avoidance in a simple choice test. H24 > ChR2-XXL larvae do not show any light avoidance after 1 min, but after 3 min suggesting that the blue light-dependent activation of ChR2-XXL induces internal reward signaling. c, d In line, H24 > Chrimson larvae prefer red light over darkness after 1 min, while genetic controls were randomly distributed. e, f Optogenetic activation of pPAM neurons using R58E02-Gal4 abolished light avoidance. g Expression pattern of R58E02-Gal4 crossed with 10xUAS-myr::GFP and stained with anti-GFP (white). Three DANs of the pPAM (protocerebral anterior medial) cluster (asterisks) and one additional cell body at the midline (arrowhead) are labeled. pPAM neurons innervate the medial lobe of the MBs. h, i Optogenetic activation of KCs abolished light avoidance in both genetic controls; in contrast experimental larvae with ablated pPAM neurons showed light avoidance after 3 min, indicating that optogenetic activation of KCs induces internal reward signaling via pPAM neurons. j Reconstituted split-GFP between H24-Gal4 positive neurons and R58E02-Gal4 positive neurons is only visible at the level of the MBs (arrowheads). bmp: basomedial protocerebrum; ChR2-XXL: channelrhodopsin2-XXL; DANs: dopaminergic neurons; es: esophagus; KCs: Kenyon cells; MBs: mushroom bodies; ml: medial lobe; 10xmyr::GFP: 10xUAS-myristoylated green-fluorescent protein; w: w1118. A pairwise Student’s t test or pairwise Wilcoxon test (both including Bonferroni-Holm correction) was used. Significance levels: n.s.p > 0.05, *p < 0.05, **p < 0.01, ***p < 0.001. Scale bars: 50 μm and 25 μm for higher magnifications. Data are mainly presented as box plots, with 50% of the values of a given genotype being located within the box, and whiskers represent the entire set of data. No data were excluded. Outliers are indicated as open circles. The median performance index is indicated as a thick line within the box plot

