Fig. 6.
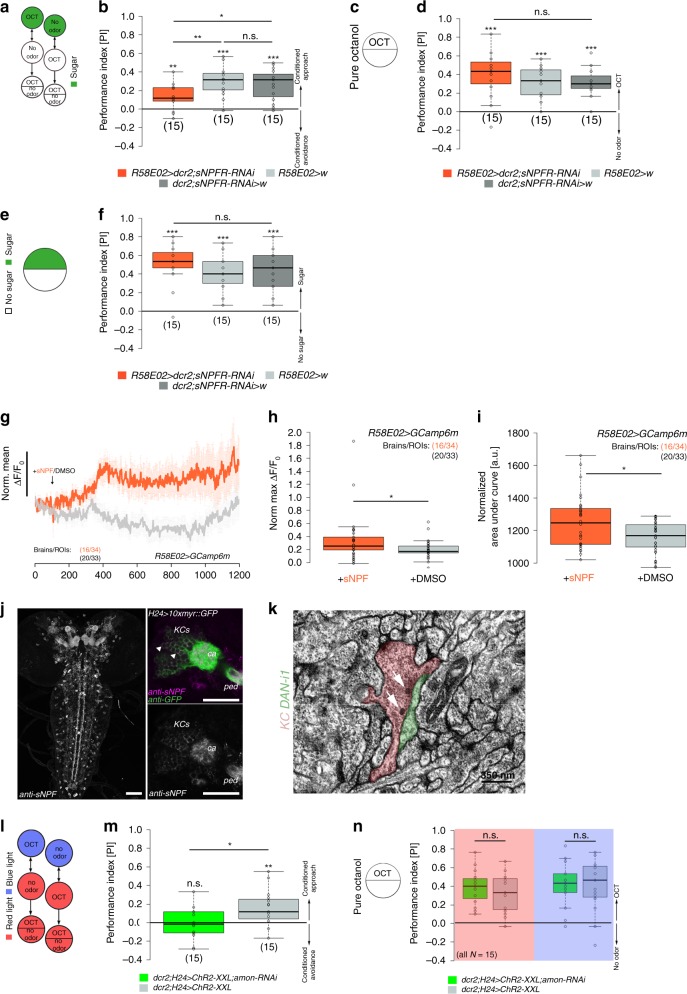
KC-to-DAN feedback signaling depends on sNPF. a Illustration of the 1-odor reciprocal training regime used in this study (odor-sugar learning). b–f Knockdown of the sNPF receptor in pPAM neurons significantly impairs odor-sugar conditioning (b), while innate odor preference (d) and sugar preference (f) is not affected. g–i pPAM neurons respond with a significant increase in intracellular fluorescence intensity to sNPF application (orange: sNPF application, N = 34 ROIs from 16 brains; gray: DMSO application, N = 33 ROIs from 20 brains) both in the maximum values (h) and area under the curve (i). j sNPF is expressed throughout the nervous system, but particularly in KCs (arrowheads). k Electron-microscopic data showing dense core vesicles (white arrows) in a KC (red) at the axonic region of the medial lobe next to the DAN-i1 pPAM neuron (green). l–n Knockdown of the protein convertase 2 encoded by amontillado impairs the optogenetically induced memory (m) in our KC-substitution assay (l), while odor preferences are not affected (n). amon: amontillado; ca: calyx; ChR2-XXL: channelrhodopsin2-XXL; dcr2: dicer2; DMSO: dimethyl sulfoxide; KCs: Kenyon cells; 10xmyr:GFP: 10xUAS-myristoylated green-fluorescent protein; OCT: octanol; ped: peduncle; ROI: region of interest; sNPF: short neuropeptide F; w: w1118. The number below the box plots refers to the N number. A pairwise Student’s t test or pairwise Wilcoxon test (both including Bonferroni-Holm correction) was used. Significance levels: n.s.p > 0.05, *p < 0.05, **p < 0.01, ***p < 0.001. Error bars (g) represent the standard error of the mean. Data are mainly presented as box plots, with 50% of the values of a given genotype being located within the box, and whiskers represent the entire set of data. No data were excluded. Outliers are indicated as open circles. The median performance index is indicated as a thick line within the box plot

