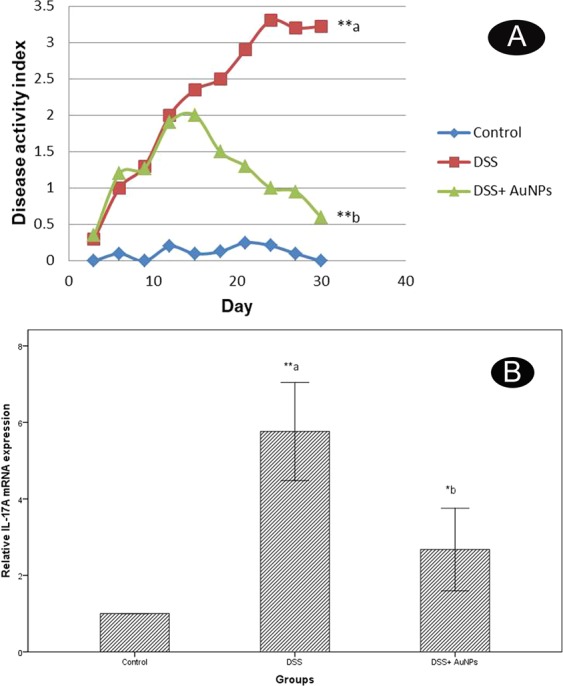
Figure 2.

(A) Changes in the disease activity index (DAI). a: P compared with control group; b: P compared with DSS group; Asterisks * and ** denote p < 0.05 and p < 0.001 respectively; n = 8. (B) Real-time PCR analysis of IL-17A expression levels in the colons of study groups. Values are estimated as a fold-increase compared to IL-17A expression in the calibrator control which is equal to 1. a: P compared with control group; b: P compared with DSS group; Asterisks * and ** denote p < 0.05 and p < 0.001 respectively; n = 8.
