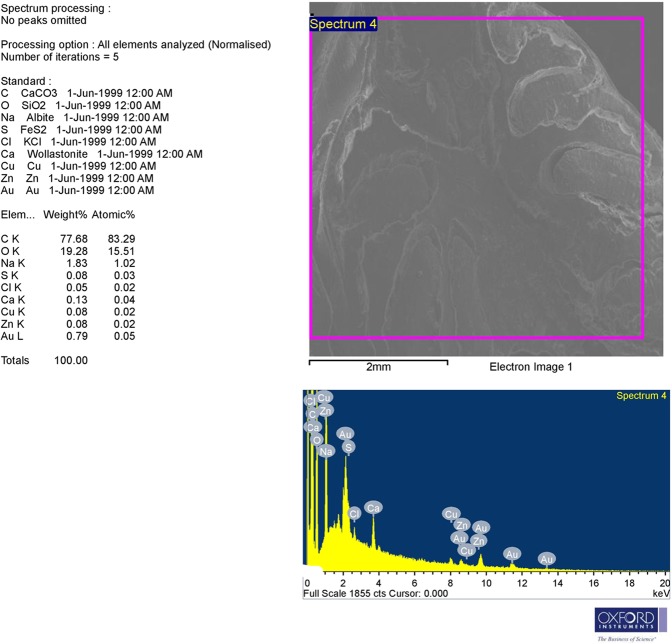
Figure 9.
The upper part: SEM image; backscattered electron image displays compositional contrast which results from different elements. The lower part: EDX analysis allows identifying these elements and their relative proportion (atomic % and weight %) by the generation of an x-ray spectrum from the entire scan area of the SEM. The Y-axis depicts the counts of x-rays and the X-axis shows their energy level (KeV). The position of the peaks identifies the elements, while the peaks height helps in the quantification of each element. Here, EDX spectrum showing significant amounts of Au (one prominent peak at 2.2 KeV with other weak peaks).

