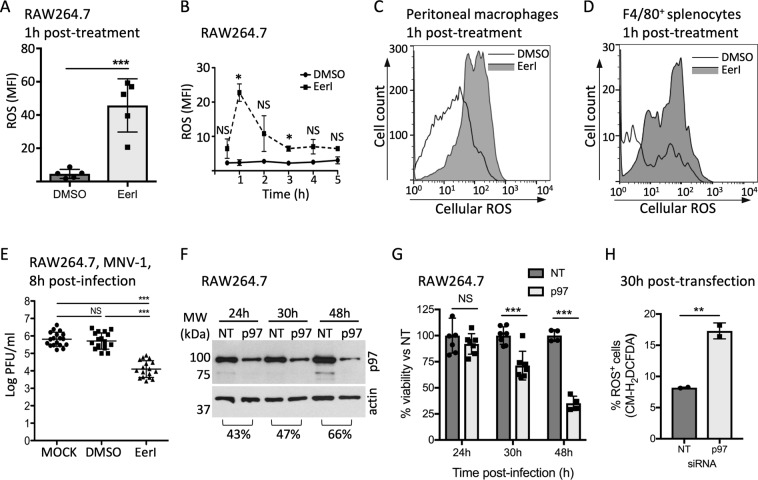
Figure 4.
Perturbation of p97 activity in macrophages induces ROS generation. (A) RAW264.7 cells were treated with 10 µM EerI for 1 h before staining with 5 µM CM-H2DCFDA. (B) Time course of ROS production in RAW264.7 following treatment with 10 µM EerI for 1 h. The MFI was calculated using FlowJo software. Peritoneal macrophages (C) and splenocytes (D) were treated for 1 h with 10 µM EerI before staining with 1.25 µM and 2 µM CM-H2DCFDA, respectively. Subsequent staining of splenocytes with F4/80+ antibody was performed to label macrophages. All FACS plots are representative of three independent experiments. (E) RAW264.7 cells were treated with 10 µM EerI for 1 h before infection with MNV-1 (MOI 5) for 1 h on ice. Viral titers were determined by counting plaque-forming units (PFU) from lysates harvested at 8 h p.i. (F) Whole cells lysates of RAW264.7 transfected with siRNA against p97 or a non-targeted control were analyzed by immunoblotting against p97. Full-length blots are presented in Supplementary Fig. 8C. Cell viability was determined using the WST-1 reagent and results represent the percent viability compared to NT control transfected cells. (H) At 30 h post-transfection, cells were stained with 5 µM CM-H2DCFDA for 0.5 h. The percentage of cells stained for ROS (% ROS+ cells) was obtained from two independent experiments. Significant differences were calculated using two-tailed Student’s t test or one-way ANOVA and Tukey’s multiple comparison test on the unmodified data (NS, not significant, *p < 0.05, **p < 0.01, ***p < 0.001). Full-length immunoblots are shown in Supplementary Fig. S7.

