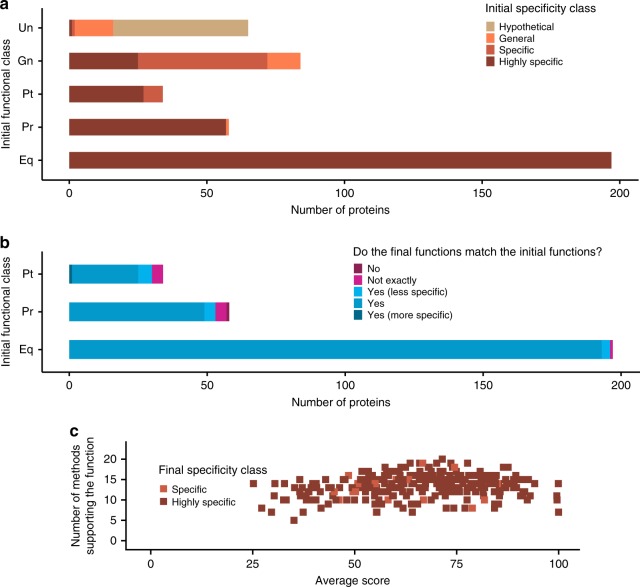
Fig. 3.
Predictions for proteins of known function encoded by the minimal genome. a Assessment of the specificity of functions predicted by Hutchison et al. across all five initial functional classes (Unknown to Equivalog). Functions from different initial specificity classes are represented by a different colour: beige for the Hypothetical specificity class, orange–General, light brown–Specific and dark brown–Highly specific. b Comparison of our predictions with the functions predicted by Hutchison et al. for proteins of known function, i.e., from the Putative, Probable and Equivalog functional classes. Colouring indicates the level of agreement between the initial functions and the predictions made here. Dark blue where the functions exactly match, medium blue where the predictions made here were less specific than the initial ones, light blue where our predictions were more specific, dark purple where there were minor differences between the functions and light purple where the function did not agree. c Number of methods supporting the function and the average score of those methods. Each point represents a protein. Methods include those used in the first step of function prediction. Specificity class colouring as for a

