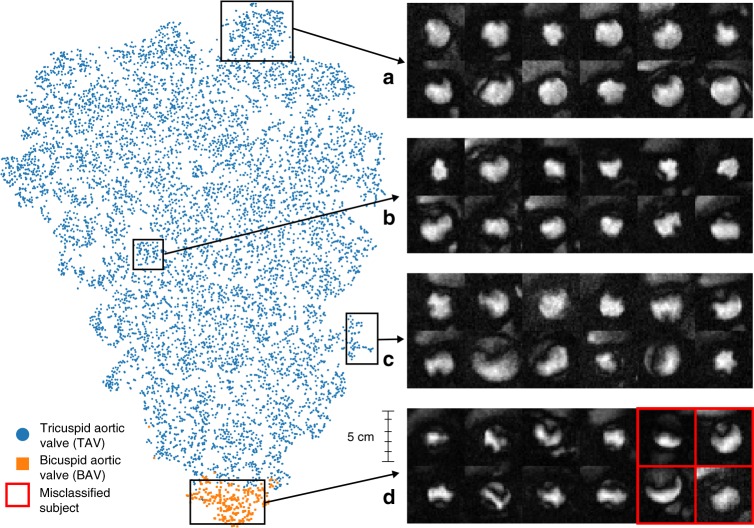
Fig. 3.
Patient clustering visualization. t-SNE visualization of the last hidden layer outputs of the CNN-LSTM model as applied to 9230 patient MRI sequences and a–d frames capturing peak flow through the aorta for a random sample of patients. Blue and orange dots represent TAV and BAV cases. The model clusters MRIs based on aortic shape and temporal dynamics captured by the LSTM. The top example box (a) contains clear TAV cases with very circular flow shapes, with (b) and (c) becoming more irregular in shape until (d) shows highly irregular flow typical of BAV. Misclassifications of BAV (red boxes) generally occur when the model fails to differentiate regurgitation of the aortic valve and turbulent blood flow through a normal appearing aortic valve orifice

