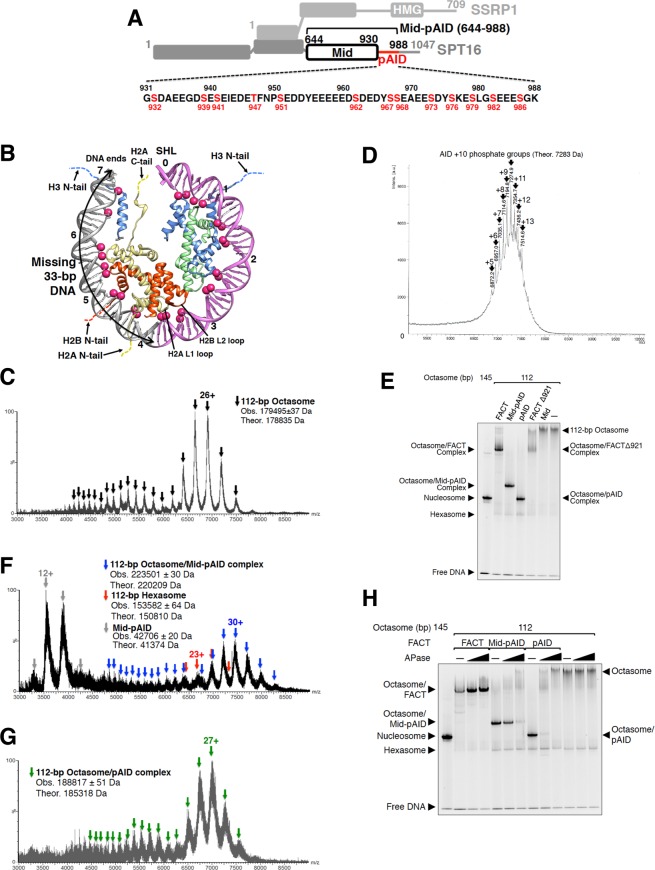
Figure 1.
pAID segment of FACT binds to the 112-bp octasome. (A) Domain organization of human FACT. The Mid-pAID, Mid, and pAID proteins were used in this structural study. The amino acid sequence of the pAID fragment (residues 931–988) is presented in the lower panel. The potential phosphorylation sites are colored red. (B) Approximately one-half of the human nucleosome structure (PDB ID: 2CV5) is shown. Deep pink spheres indicate the DNA phosphate groups forming contacts with histones (H2A, H2B, H3, and H4, colored yellow, red, blue, and green, respectively). The 112-bp DNA is colored orchid. The missing 33-bp DNA is depicted in gray, and is marked by arrows. Dotted lines denote histone tails. Numbers indicate superhelix locations (SHL), which represent the numbers of double turns from the nucleosome dyad (0). (C) Native ESI mass spectrum of the 112-bp octasome alone. Arrowheads correspond to multiply charged ions of the 112-bp octasome. The charge state of the mainly observed peak is labeled above the peak. (D) MALDI-TOF mass spectrum of the pAID fragment. The mass shift of approximately 80 Da from the theoretical mass of the non-phosphorylated AID (6483 Da) indicates the addition of a phosphoryl group. The observed mass indicated on each peak was consistent with the theoretical mass of multiply phosphorylated AID. The numbers of attached phosphate groups are labeled above the arrowheads. (E) EMSAs (electrophoretic mobility shift assays) show the complexes of the 112-bp octasome with the FACT, Mid-pAID, pAID, FACTΔ921, or Mid proteins, detected by SYBR Gold nucleic acid gel stain. The 112-bp octasomes with the FACT proteins showed faster migration than the 112-bp octasome alone, because the negative charge is increased by the complex formation. Experiments were repeated at least three times. (F,G) Native ESI mass spectra of the 112-bp octasome reconstituted with Mid-pAID (F) or pAID (G). Blue, red, gray, and green arrowheads show the corresponding peaks for the respective complexes, as indicated. The theoretical masses are calculated from those of the non-phosphorylated proteins. The charge states of the mainly observed peak are labeled above the peak. (H) EMSAs show the complexes of the 112-bp octasome with the FACT proteins treated by APase, detected by SYBR Gold nucleic acid gel stain. The complexes between the 112-bp octasome and the FACT proteins were incubated with buffer (−), 0.3 U, or 3 U APase for 2 h at 20 °C. Experiments were repeated at least three times.

