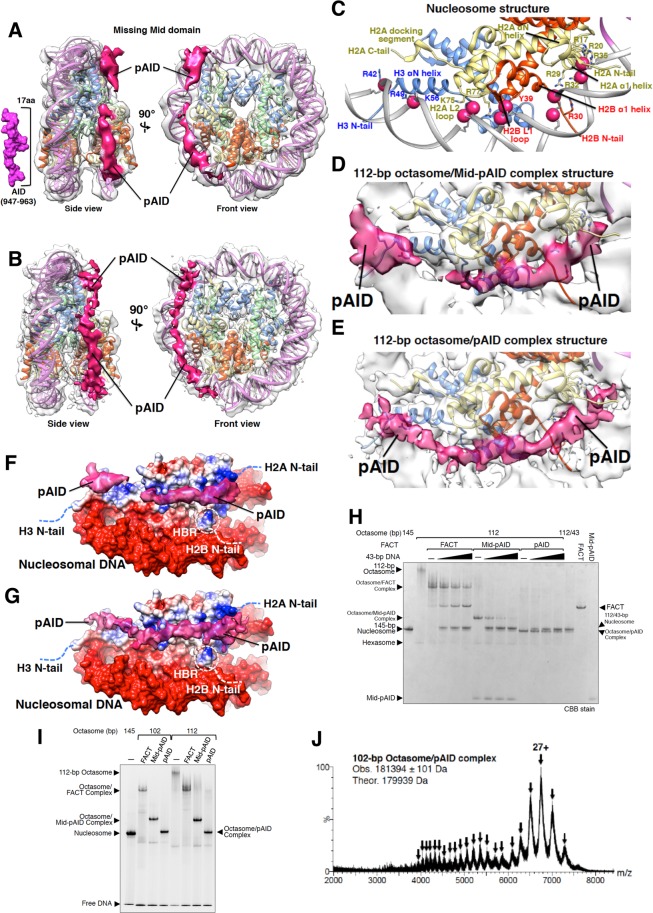
Figure 2.
pAID replaces the canonical DNA binding sites with histones within nucleosome. (A,B) Cryo-EM structures of the 112-bp octasomes complexed with Mid-pAID (A) and pAID (B), respectively. Two different views of the cryo-EM density map are superimposed onto the nucleosome structure (PDB ID: 2CV5), which lacks the 33-bp DNA (colored as in Fig. 1B). pAID is indicated by a deep pink density. The density of the Mid domain is blurred out during the averaging process in the 3D reconstruction. The surface model corresponding to 17 residues of pAID (947T-963D) is visualized as a scale bar. (C–E) Detailed views of DNA-histone contacts in nucleosome (C) and pAID-histone contacts in the 112-bp octasome/Mid-pAID complex (D) and the 112-bp octasome/pAID complex (E), colored as in Fig. 1B. The contacts appear to share key residues in histone proteins (R42, R49 and K56 of H3, R30 and Y39 of H2B, and R17, R20, R29, R32, R35, K75, and R77 of H2A). These residues are depicted. (F,G) Electrostatic surfaces of the pAID binding sites in the 112-bp octasome/Mid-pAID complex (F) and the 112-bp octasome/pAID complex (G). pAID is indicated by a deep pink density. 112-bp octasomes are shown as electrostatic potential surfaces, colored between −7.0 kT/e (red) and 7.0 kT/e (blue). Dotted lines denote histone tails. White doted circles show the locations of HBR proximate to the H2B N-tail. (H) Competitive binding assay between the FACT proteins and the 43-bp DNA performed using the 112-bp octasome, detected by EMSAs. The complexes between the 112-bp octasome and the FACT proteins were titrated with buffer (−), 1.0, 3.3, or 10-fold molar amounts of the 43-bp DNA. The proteins were stained by Coomassie Brilliant Blue (CBB). Experiments were repeated at least three times. (I) EMSAs show the complexes of the 102-bp or 112-bp octasomes with the FACT, Mid-pAID, or pAID proteins, detected by SYBR Gold nucleic acid gel stain. Experiments were repeated at least three times. (J) Native ESI mass spectrum of the 102-bp octasome reconstituted with pAID. Arrowheads correspond to multiply charged ions of the complex. The charge state of the mainly observed peak is labeled above the peak. The theoretical masses are calculated from those of the non-phosphorylated proteins.

