Fig. 5.
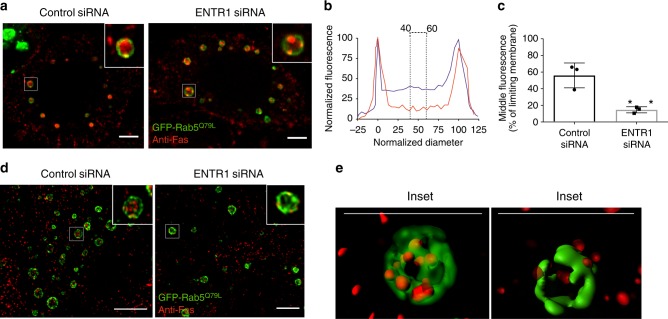
Depletion of ENTR1 delays sorting of Fas into intraluminal vesicles. a Immunofluorescence of Fas in cells transfected with constitutively active Rab5 Q79L. Control or ENTR1 no.3 siRNA treated HeLa cells were transfected with Rab5 Q79L-GFP and stimulated with anti-Fas (CH-11) antibody (1 µg/ml) for 1 h in the presence of leupeptin (100 nM). Cells were fixed and observed by a confocal microscope. Insets show representative expanded endosomes. b Example of line scale analysis used for quantifying Fas localised to intraluminal vesicles. The normalised diameter represents the diameter of the endosome, where 0 and 100 correspond to the pixel distances with the highest and second highest pixel intensities, representing the limiting membranes of the endosomes. Blue and red traces represent the normalised fluorescence pixel intensity measured across the endosomes in control and ENTR1 depleted cells, respectively, with the maximum pixel intensity across the line normalised to 100. Region covered by dotted line shows the normalised fluorescence values of pixels from 40–60% of the normalised diameter that were used to determine the mean intraluminal fluorescence for each endosome. c Graphical representation of the compiled results of the line scale analysis for Fas. Middle (40–60%) fluorescence value expressed as a percentage of the limiting membrane (normalised diameter). Unpaired t-test, n > 50 endosomes from three independent experiments, **p < 0.01, p = 0.0075, error bars represents ± s.e.m. d Immunofluorescence analysis of intraluminal sorting of Fas in control or ENTR1 no.3 siRNA treated HeLa cells transfected with constitutively active Rab5 Q79L using 3D-Structured illumination microscopy. e Three-dimensional modelling of endosomes highlighted by the insets in d. Scale bars represent 5 µm (a, d, e)

