Fig. 9.
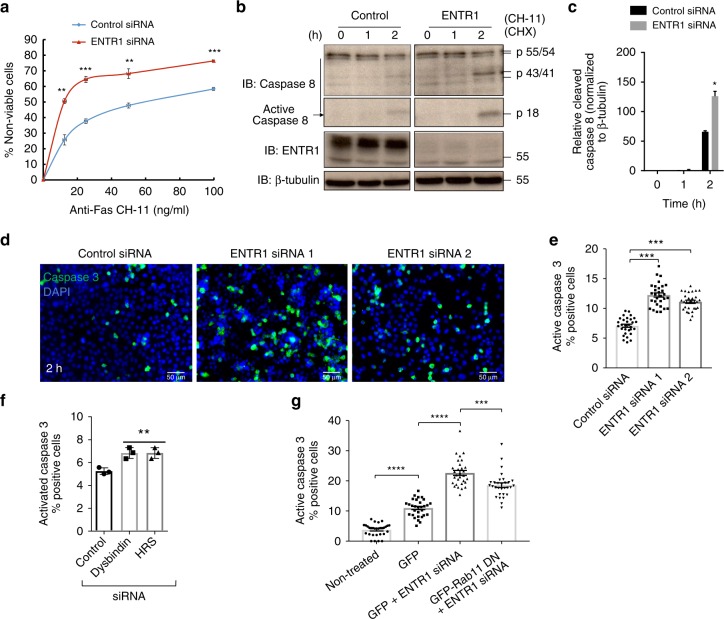
Reduced ENTR1 expression increases sensitivity to Fas induced apoptosis. a Cell viability was measured using MTT assay for HeLa cells treated with control or ENTR1 siRNA. A dose-dependent curve was generated indicating percentage of non-viable cells (three independent experiments, n = 3, **p < 0.01, ***p < 0.001, error bars represent ± s.e.m, student t-test. b Immunoblot analysis of caspase 8 cleavage upon activation of HeLa cells treated with control or ENTR1 no.3 siRNA. Cells were incubated with 500 ng/ml of anti-Fas (CH-11) antibody and 100 µg/ml of cycloheximide for the indicated time points. ß-tubulin was used as negative control. Uncropped blots are shown in Supplementary Fig. 11. c Quantification of cleaved caspase 8 fragments (p18) in control and ENTR1 knock-down samples normalised to ß-tubulin. X-ray films were scanned and quantified with ImageJ. Data was collected from three independent experiments (n = 3), ANOVA test was performed, *p < 0.05, error bars represent ± s.e.m d Immunofluorescence analysis of activated caspase 3 in HeLa in control or ENTR1 no.1 and no.2 siRNA cells after 2 h of sFasL (0.5 ug/ml) and CHX (50 ug/ml) treatment. e Quantification of the cells positive for activated caspase 3 in each condition. Data was collected from three independent experiments (n = 3), One-way ANOVA was performed, **p < 0.01, error bars represent ± SEM f Graphical representation of activated caspase 3 positive cells in control and Dysbindin or HRS siRNA treated cells. Data was collected from three independent experiments (n = 3), One-way ANOVA was performed, **p < 0.01, error bars represent ± s.e.m. g Quantification of the activated caspase 3 in untreated or treated (CH11 500 ng/ml and CHX 150 ug/ml) HeLa cells transfected with the indicated expression constructs. Data was collected from three independent experiments (n = 3), One-way ANOVA was performed, **p < 0.01, ***p < 0.001, error bars represent ± SEM

