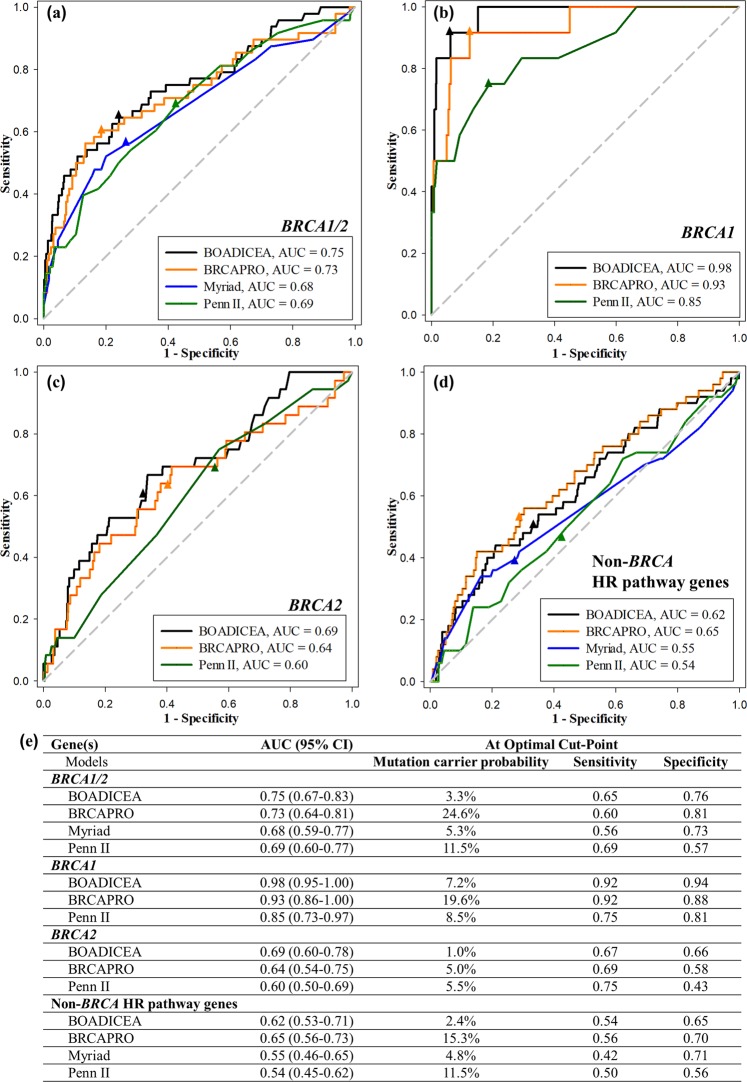
Figure 1.
Performance of four BRCA mutation risk predictive models using ROC curves; the respective AUC for each model is shown at the right lower corner of the curves and in panel (e); the optimal cut-points (closest point to the left upper corner) are shown as triangles on each curve. (a) BRCA1/2: probability of BRCA1 or BRCA2 mutation prediction using the BOADICEA, BRCAPRO, Myriad, and Penn II models; (b) BRCA1 only: probability of BRCA1 mutation prediction using the BOADICEA, BRCAPRO, and Penn II models; (c) BRCA2 only: probability of BRCA2 mutation prediction using the BOADICEA, BRCAPRO, and Penn II models; (d) Non-BRCA HR pathway genes: probability of HR pathway gene other than BRCA1/2 (ATM, BARD1, BRIP1, PALB2, RAD50, RAD51C, RAD51D) mutation prediction using the BOADICEA, BRCAPRO, Myriad, and Penn II models; (e) AUC with 95% confidence interval (CI) for each model and each gene set, as well as mutation carrier probability, sensitivity, and specificity at the optimal cut-point for each curve are listed.

