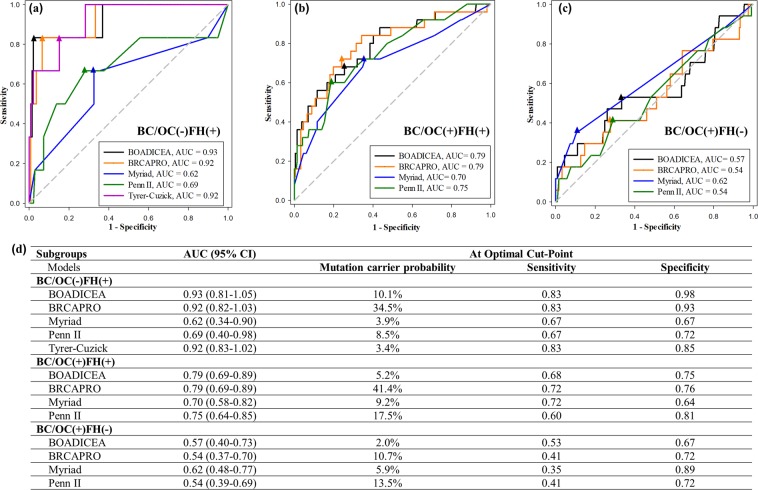
Figure 2.
Performance of five BRCA mutation risk predictive models in the three subgroups using ROC curves; the respective area under the curve (AUC) for each model is shown at the right lower corner of the curves and in panel (d); the optimal cut-points (closest point to the left upper corner) are shown as triangles on each curve. (a) BC/OC(−)FH(+): in unaffected women with no personal history but with family history of breast or ovarian cancer, the probability of BRCA1 or BRCA2 mutation prediction using the BOADICEA, BRCAPRO, Myriad, Penn II and Tyrer-Cuzick models; (b) BC/OC(+)FH(+): in women with both personal history and family history of breast or ovarian cancer, the probability of BRCA1 or BRCA2 mutation prediction using the BOADICEA, BRCAPRO, Myriad, and Penn II models; (c) BC/OC(+)FH(−): in women with personal history but no family history of breast or ovarian cancer, the probability of BRCA1 or BRCA2 mutation prediction using the BOADICEA, BRCAPRO, Myriad, and Penn II models; (d) AUC with 95% confidence interval (CI) for each subgroup and each model, as well as mutation carrier probability, sensitivity, and specificity at the optimal cut-point for each curve are listed.

