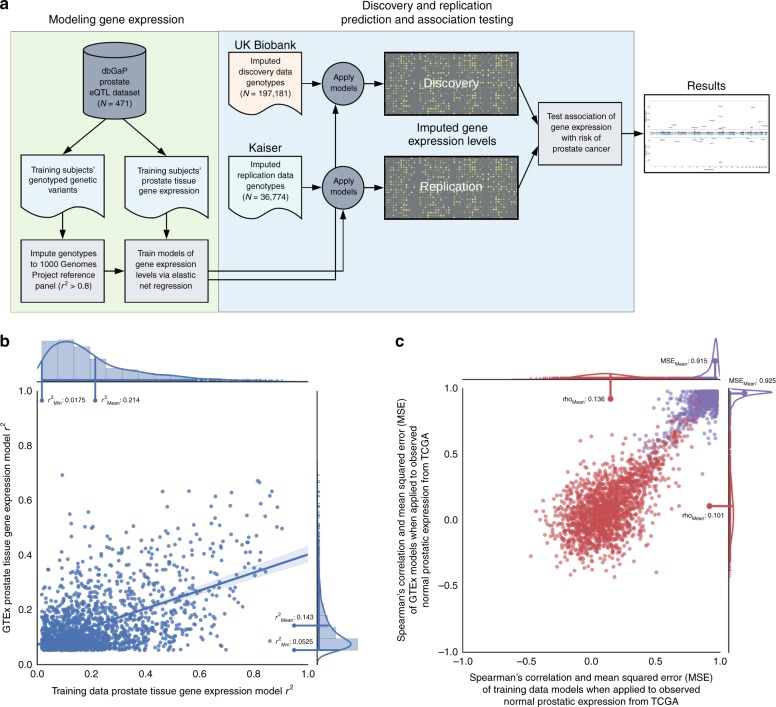
Fig. 1.
TWAS experimental design and comparison of reference panel model performance. a Experimental design for TWAS study of prostate cancer risk. b Scatter plot comparison of the cross-validated performance r2 for 1884 gene expression models derived from GTEx prostate data (N = 87 subjects) vs. the training dataset for the present study (N = 471). In addition to a linear regression line and 95% confidence interval, marginal histograms and density curves are included for both the x-axis (training data model performance) and y-axis (GTEx model performance), with the minimum and mean r2 values also labeled. Performance r2 was computed based on in-sample cross-validation in each respective dataset. c Scatter plot comparison of the out-of-sample model performance for models derived from GTEx vs. the training dataset. Both sets of models were applied to a TCGA normal prostate tissue dataset (N = 45) to measure the relationship between observed and imputed expression for 1753 genes. The correlation (Spearman’s rho) between imputed and observed expression is illustrated in red, while the mean squared error of the predictions is illustrated in violet, both with marginal density curves

