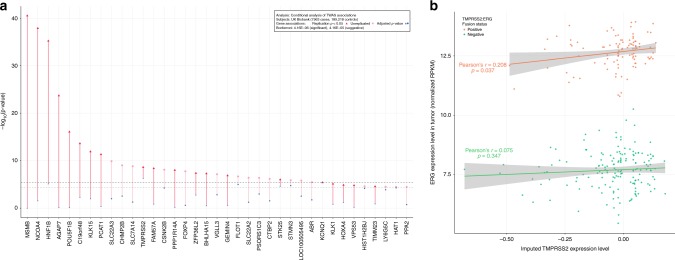
Fig. 3.
TWAS analysis conditional upon prostate cancer risk GWAS variants and correlation between imputed TMPRSS2 expression and observed ERG expression in TCGA prostate tumors. a Comparison of the associations in the UK Biobank discovery cohort before (red or pink) and after (blue) adjusting a gene’s association (y-axis, −log10(p-value)) for the genotypes at the previously reported lead variant for an adjacent prostate cancer risk GWAS locus. When the lead variant was not present in the imputed UK Biobank genotype dataset, a suitable proxy (r2 > 0.8 in 1000 Genomes Phase III EUR) was used if available. The p-value threshold for Bonferroni-corrected significance (Logistic Regression p < 4.16 × 10⁻⁶) is illustrated by a dashed black line, and the suggestive p-value threshold by a dashed grey line. Genes nominally significant (p < 0.05) or unreplicated in the Kaiser Permanente RPGEH replication cohort are illustrated as red triangles and pink circles, respectively. b Scatter plot illustrating the relationship between imputed expression of TMPRSS2 in normal prostate tissue as predicted by germline cis-eQTL genotypes (x-axis) and observed tumoral expression of ERG (y-axis) in prostate cancer cases from The Cancer Genome Atlas (TCGA). Data are colored by TMPRSS2:ERG (T2E) fusion status for T2E-positive (orange, N = 101) and T2E-negative (green, N = 161) subjects, as inferred from paired-end RNA-Seq data. Linear regression lines and 95% confidence intervals illustrate the respective means and trends for T2E-positive and T2E-negative subjects

