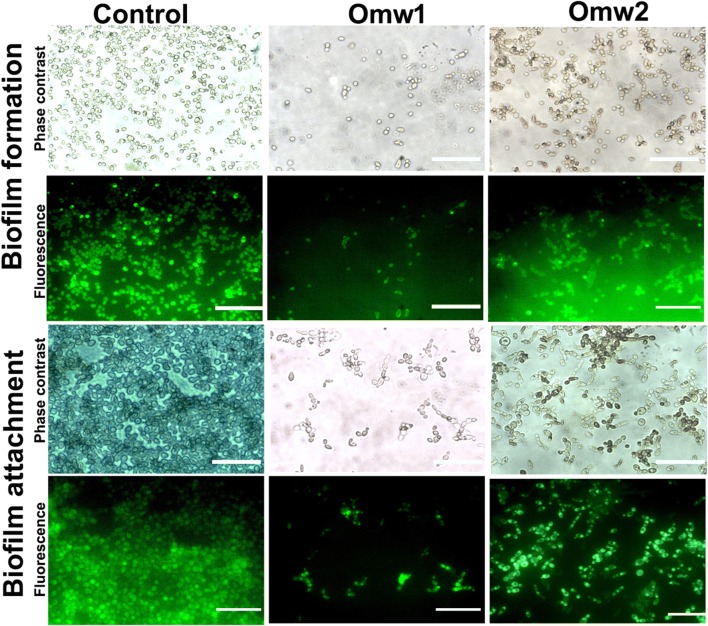
Fig. 6.
Phase contrast and fluorescence micrographs of antibiofilm activity of omw1 and omw2 at 1/2× MIC. The treated and untreated cells were exposed to Acridine orange and observed under fluorescence microscope at 60×. The significant reduction in number of Candida cells in the treated plate reflects the antibiofilm activity of the two peptides both to inhibit the formation as well wash-out the established biofilms when compared to control. Row 1 depicts the phase contrast image of biofilm formation in the presence or absence of peptides, omw1 and omw2. Row 2 is the same microscopic field as Row 1 observed under blue filter. Rows 3 and 4 are the images showing mature biofilms disrupting properties of omw1 and omw2 under phase contrast and fluorescence lights, respectively

